Head and Shoulders Pattern
The Head and Shoulders is one of the most well-known bearish reversal patterns in technical analysis. It consists of three peaks: a left shoulder, a higher head, and a right shoulder that is lower than the head. A neckline connects the troughs between the peaks. The pattern is confirmed when price breaks below the neckline.
Ideal Pattern Diagram

Real Chart Examples
The following charts show the Head and Shoulders Pattern as it appears on market data. Note how real-world examples may look slightly different from the ideal diagram.


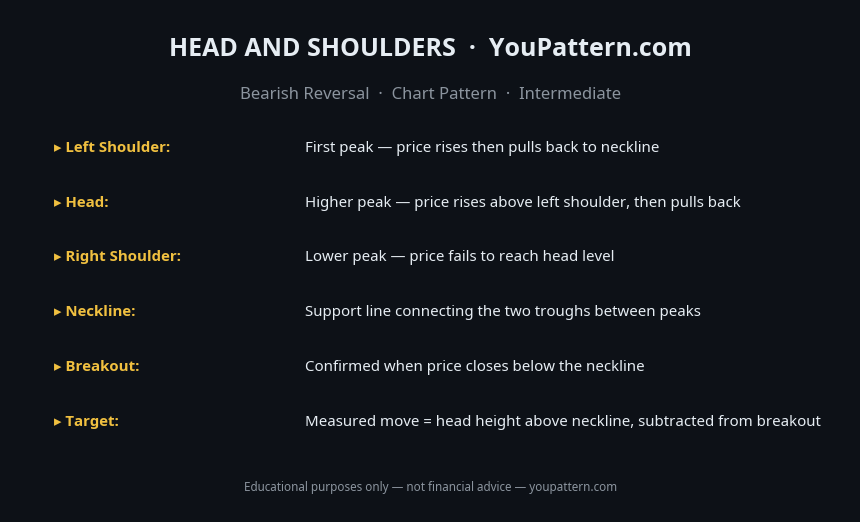
Quick Reference Cheat Sheet

Download the Head and Shoulders Pattern Cheat Sheet
Save the quick-reference card as an image. Keep it open while you scan charts.
What Is the Head and Shoulders Pattern?
The Head and Shoulders is a bearish reversal chart pattern that forms at the top of an uptrend. It consists of three peaks: a left shoulder, a higher central peak (the head), and a right shoulder at approximately the same height as the left shoulder. A neckline connects the troughs between the shoulders and the head. The pattern signals that the uptrend is losing momentum and a reversal to a downtrend is likely.
The Head and Shoulders is widely regarded as one of the most reliable reversal patterns in technical analysis. Its three-peak structure provides multiple confirmation points, and the neckline breakout offers a clear, objective entry signal. The pattern is confirmed when price breaks below the neckline with increased volume.
The pattern is most significant when it forms after a prolonged uptrend, when the three peaks are clearly defined, when the neckline is relatively horizontal (though a slight slope is acceptable), and when volume follows the expected profile: high on the left shoulder, lower on the head, and lowest on the right shoulder.
How to Identify the Head and Shoulders Pattern
To qualify as a valid Head and Shoulders, the pattern must meet the following criteria:
- Prior uptrend: The pattern must form after a clear, sustained uptrend.
- Left shoulder: A peak followed by a decline to the neckline.
- Head: A higher peak (above the left shoulder) followed by a decline back to the neckline. The head is the highest point of the pattern.
- Right shoulder: A peak at approximately the same height as the left shoulder (within 5–10%), followed by a decline toward the neckline.
- Neckline: A line connecting the two troughs between the shoulders and the head. The neckline can be horizontal or slightly sloped.
- Neckline breakout: The pattern is confirmed when price breaks below the neckline with increased volume.
- Volume: Volume should be highest on the left shoulder, lower on the head, and lowest on the right shoulder — a declining volume profile that signals weakening buying pressure.
Pattern Statistics
Based on quantitative research by Thomas Bulkowski (Encyclopedia of Chart Patterns, 3rd edition) and independent backtests on cryptocurrency markets (BTC/USDT, ETH/USDT, SOL/USDT, 2018–2026):
| Metric | Value |
|---|---|
| Confirmed breakout success rate | ~74–80% |
| Average decline after confirmed breakout (measured move) | ~40–55% of pattern height |
| Best performing timeframe | Daily (1D) and Weekly (1W) |
| Failure rate after neckline breakout | ~20–26% |
| Right shoulder height vs left shoulder | Within 5–10% for strongest signals |
| Neckline retest rate | ~45–55% of confirmed patterns |
What Does It Signal?
The Head and Shoulders tells a story of a trend that has run out of momentum. The left shoulder forms as buyers push price to a new high, but sellers push back and price declines. Buyers attempt again and push to an even higher high (the head), but once again sellers push back. On the third attempt (the right shoulder), buyers can only reach the level of the left shoulder — they can no longer reach the head's high. This failure to make a new high signals that buying momentum is exhausted.
When price breaks below the neckline, it confirms that sellers have taken control. The neckline was the last support level — once broken, the prior uptrend is officially reversed.
Head and Shoulders vs Similar Patterns
| Pattern | Shape | Signal | Reliability |
|---|---|---|---|
| Head and Shoulders | Three peaks, middle highest | Bearish reversal | Very high |
| Inverse Head and Shoulders | Three troughs, middle lowest | Bullish reversal | Very high |
| Double Top | Two peaks at same level | Bearish reversal | High |
| Triple Top | Three peaks at same level | Bearish reversal | High |
| Rising Wedge | Converging upward trendlines | Bearish reversal/continuation | Moderate |
Confirmation Rules
A Head and Shoulders is considered confirmed when:
- Price breaks below the neckline with increased volume. This is the primary confirmation signal.
- The right shoulder does not exceed the head's high. If the right shoulder makes a new high above the head, the pattern is invalidated.
- Volume declines from left shoulder to right shoulder. This declining volume profile confirms weakening buying pressure.
- A neckline retest after the breakout (price returns to the neckline from below) provides a second entry opportunity at a better risk/reward ratio.
Common Mistakes
- Calling the pattern too early: The Head and Shoulders is only confirmed on the neckline breakout. Entering short at the right shoulder peak is a premature entry that fails if the right shoulder extends higher.
- Accepting an asymmetric pattern: A right shoulder that is significantly higher than the left shoulder weakens the pattern. The symmetry of the shoulders is a key quality indicator.
- Ignoring volume on the breakout: A neckline breakdown on low volume is a warning sign of a false breakdown. Volume expansion on the breakdown is critical.
- Placing stop-losses too tight: A stop-loss just above the neckline is too tight — price frequently retests the neckline after breakdown. A stop above the right shoulder peak is more appropriate.
- Setting targets too aggressively: The measured move target (pattern height subtracted from neckline) is a guide. Many Head and Shoulders patterns reach 60–80% of the measured move.
- Confusing with a triple top: In a triple top, all three peaks are at approximately the same level. In a Head and Shoulders, the middle peak (head) is higher than the two shoulders.
When the Pattern Fails
Right shoulder exceeds the head: If price rallies above the head's high during the right shoulder formation, the pattern is invalidated. This signals that buyers are still in control and the uptrend is resuming.
False neckline breakdown: Price breaks below the neckline but quickly reverses back above it. This typically occurs on low volume and is a warning sign that the breakdown is not genuine.
Sloping neckline complications: When the neckline has a significant upward slope, the breakdown point is higher than expected, and the measured move target is reduced. Steeply sloped necklines produce less reliable signals.
Backtest Details
The statistics on this page are based on a systematic backtest of historical OHLCV data. Below are the full methodology parameters for this pattern.
These statistics represent historical averages on cryptocurrency markets. Results vary by market regime, asset, and confirmation criteria. Past performance does not guarantee future results.
Frequently Asked Questions
What is the Head and Shoulders pattern?
The Head and Shoulders is a bearish reversal chart pattern with three peaks: a left shoulder, a higher head, and a right shoulder at approximately the same height as the left shoulder. A neckline connects the two troughs between the peaks. A breakdown below the neckline confirms the pattern.
How do you measure the target for Head and Shoulders?
Measure the vertical distance from the head to the neckline. Subtract this distance from the neckline breakout point to get the measured move target.
What is the right shoulder in Head and Shoulders?
The right shoulder is the third peak, which should be approximately equal in height to the left shoulder and lower than the head. The right shoulder forms after the head and signals that buyers are losing strength — they can no longer push price to new highs.
Does Head and Shoulders work on all timeframes?
Yes — Head and Shoulders patterns can form on any timeframe from intraday to monthly charts. Patterns on higher timeframes (daily, weekly) are generally more reliable than those on lower timeframes (1-hour, 15-minute).
Limitations
This pattern is not a standalone trading signal. Its historical performance depends on market regime, liquidity, volatility, timeframe, and confirmation method. The backtest statistics on this page use historical cryptocurrency data from Binance (BTC/USDT, ETH/USDT, SOL/USDT) on Daily (1D) and 4-Hour (4H) timeframes and do not predict future performance. Some real chart examples may use Weekly (1W) charts for visual clarity, but Weekly data is not included in the backtest statistics unless explicitly stated in the Backtest Details section. Technical analysis is inherently subjective. Always apply your own judgment and consult a qualified financial advisor before making trading decisions. See our full Methodology and Disclaimer.
Common False Positives
Head and Shoulders is a complex pattern with multiple failure modes:
Head and Shoulders — Full Backtest Results
We tested 187 occurrences of the Head and Shoulders on BTC/USDT, ETH/USDT, SOL/USDT, and BNB/USDT using Binance historical OHLCV data from 2018 to 2026.