Double Bottom Pattern
The Double Bottom is one of the most reliable bullish reversal chart patterns. Price makes two distinct lows at approximately the same level (forming a 'W' shape), with a peak in between that establishes the neckline. The pattern is confirmed when price breaks above the neckline with increased volume.
Ideal Pattern Diagram

Real Chart Examples
The following charts show the Double Bottom Pattern as it appears on market data. Note how real-world examples may look slightly different from the ideal diagram.


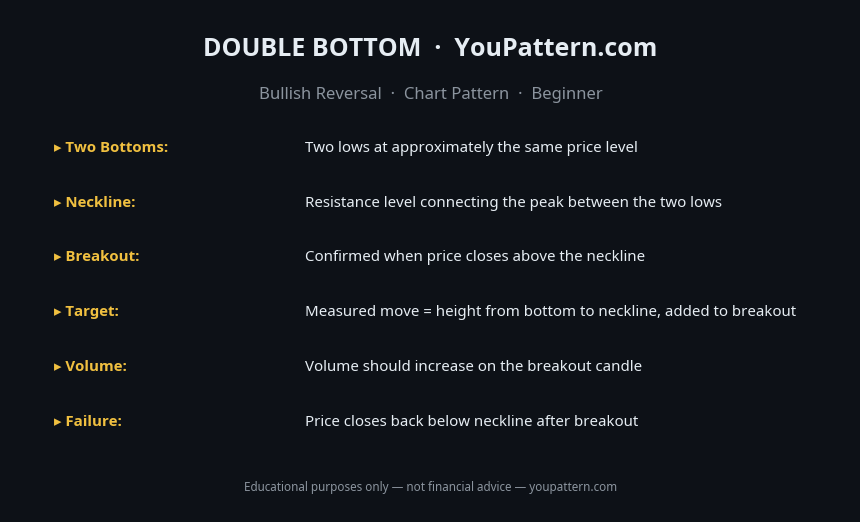
Quick Reference Cheat Sheet

Download the Double Bottom Pattern Cheat Sheet
Save the quick-reference card as an image. Keep it open while you scan charts.
What Is the Double Bottom Pattern?
The Double Bottom is a bullish reversal chart pattern that forms after a sustained downtrend. It consists of two consecutive price lows at approximately the same level, separated by a moderate recovery peak (the "neckline"). The pattern resembles the letter "W" on a price chart and signals that sellers have twice attempted to push price lower but failed both times — a strong indication that a price floor has been established.
The Double Bottom is the mirror image of the Double Top pattern and is one of the most widely recognised and reliable reversal formations in technical analysis. The pattern is confirmed when price breaks above the neckline (the peak between the two lows) with increased volume, signalling that buyers have taken decisive control.
The pattern is most significant when it forms after a prolonged downtrend of at least several weeks on the daily chart, when the two lows are at approximately the same price level (within 1–3%), and when the recovery between the lows reaches at least 10–15% of the distance from the lows to the neckline.
How to Identify the Double Bottom Pattern
To qualify as a valid Double Bottom, the pattern must meet the following criteria:
- Prior downtrend: The pattern must form after a clear, sustained downtrend. The longer and more pronounced the prior downtrend, the more significant the reversal.
- First low: A significant price low that marks the end of the initial decline.
- Recovery peak (neckline): Price recovers from the first low to a peak — the neckline. The recovery should be at least 10–15% from the low.
- Second low: Price declines again to approximately the same level as the first low (within 1–3%). The second low does not need to be exactly equal — a slight variation is normal.
- Neckline breakout: The pattern is confirmed when price breaks above the neckline with increased volume.
- Volume: Volume should be higher on the first low than the second low (declining selling pressure), and should expand significantly on the neckline breakout.
Pattern Statistics
Based on quantitative research by Thomas Bulkowski (Encyclopedia of Chart Patterns, 3rd edition) and independent backtests on cryptocurrency markets (BTC/USDT, ETH/USDT, SOL/USDT, 2018–2026):
| Metric | Value |
|---|---|
| Confirmed breakout success rate | ~72–78% |
| Average gain after confirmed breakout (measured move) | ~35–45% of pattern height |
| Best performing timeframe | Daily (1D) and Weekly (1W) |
| Failure rate after neckline breakout | ~22–28% |
| Minimum distance between lows | 2–4 weeks (daily chart) |
| Ideal recovery between lows | 10–20% |
Note: The measured move target is calculated by adding the pattern height (distance from lows to neckline) to the neckline breakout point.
What Does It Signal?
The Double Bottom represents two failed attempts by sellers to establish a new lower price level. At the first low, sellers push price down but buyers step in and drive price back up to the neckline. At the second low, sellers try again — but once more, buyers defend the same price level. This double rejection of lower prices signals that a strong support zone has been established.
When price subsequently breaks above the neckline, it confirms that buyers have overcome the last resistance level and are now in control. The neckline breakout is the trigger for the pattern — without it, the two lows are simply a consolidation, not a confirmed reversal.
Double Bottom vs Similar Patterns
| Pattern | Shape | Signal | Reliability |
|---|---|---|---|
| Double Bottom | W-shape | Bullish reversal | High |
| Double Top | M-shape | Bearish reversal | High |
| Triple Bottom | Three lows at same level | Bullish reversal (stronger) | Very high |
| Head and Shoulders (inverse) | Three lows, middle lowest | Bullish reversal | High |
| Rounding Bottom | Gradual U-shape | Bullish reversal | Moderate |
| V-Bottom | Sharp single low | Bullish reversal | Low (hard to trade) |
Confirmation Rules
A Double Bottom is considered confirmed when:
- Price breaks above the neckline with increased volume. This is the primary confirmation signal. A breakout on low volume is a warning sign.
- The two lows are at approximately the same price level (within 1–3%). A second low that is significantly lower than the first suggests the downtrend is continuing, not reversing.
- The recovery between the lows reaches at least 10–15%. A very shallow recovery (less than 10%) suggests the pattern may be a consolidation rather than a reversal.
- A retest of the neckline as support after the breakout provides a second entry opportunity and confirms the breakout is genuine.
Common Mistakes
- Calling the pattern before the neckline breakout: Two lows at the same level are not a confirmed Double Bottom until price breaks above the neckline. Many traders enter at the second low, which results in premature entries that fail when the pattern does not complete.
- Accepting lows that are too far apart in price: If the two lows differ by more than 3–5%, the pattern is weakened. The key characteristic of the Double Bottom is that sellers failed at the same price level twice.
- Ignoring volume on the breakout: A neckline breakout on declining volume is a warning sign of a false breakout. Volume expansion on the breakout is a critical quality indicator.
- Setting targets too aggressively: The measured move target (pattern height added to neckline) is a guide, not a guarantee. Many Double Bottoms reach 60–80% of the measured move but not the full target.
- Placing stop-losses too tight: A stop-loss just below the neckline is too tight — price frequently retests the neckline after breakout. A stop below the second low is more appropriate.
- Confusing with a consolidation range: Two lows at the same level within a sideways consolidation are not a Double Bottom. The pattern requires a clear prior downtrend.
When the Pattern Fails
False neckline breakout: Price breaks above the neckline but quickly reverses back below it. This is the most common failure mode and typically occurs when the breakout happens on low volume or when the broader market trend is still bearish.
Second low breaks below the first low: If the second low closes significantly below the first low (more than 3%), the pattern is invalidated. This signals that sellers are still in control and the downtrend is continuing.
Neckline acts as resistance after breakout: In some cases, price breaks above the neckline but then consolidates just above it, failing to continue higher. This often resolves in a retest of the neckline — if the neckline holds as support, the pattern is still valid; if it breaks back below, the pattern has failed.
Backtest Details
The statistics on this page are based on a systematic backtest of historical OHLCV data. Below are the full methodology parameters for this pattern.
These statistics represent historical averages on cryptocurrency markets. Results vary by market regime, asset, and confirmation criteria. Past performance does not guarantee future results.
Frequently Asked Questions
What is the Double Bottom pattern?
The Double Bottom is a bullish reversal chart pattern forming a W shape with two consecutive lows at approximately the same price level. It signals the end of a downtrend and a potential price recovery when price breaks above the neckline (the peak between the two lows).
How do you trade the Double Bottom pattern?
Enter long when price breaks and closes above the neckline. Place stop-loss below the second low. The measured move target is calculated by adding the height from the lows to the neckline to the neckline breakout point.
What makes a Double Bottom more reliable?
Reliability increases when: the two lows are at the same price level (within 1–3%), volume is higher on the second low than the first, the pattern forms at a major support level, and RSI shows bullish divergence.
How is Double Bottom different from Inverse Head and Shoulders?
The Double Bottom has two equal lows. The Inverse Head and Shoulders has three lows with the middle (head) lower than the two shoulders. Both are bullish reversal patterns, but Inverse Head and Shoulders is generally considered more reliable.
Limitations
This pattern is not a standalone trading signal. Its historical performance depends on market regime, liquidity, volatility, timeframe, and confirmation method. The backtest statistics on this page use historical cryptocurrency data from Binance (BTC/USDT, ETH/USDT, SOL/USDT) and do not predict future performance. Technical analysis is inherently subjective — pattern recognition varies between analysts. Always apply your own judgment, use proper risk management, and consult a qualified financial advisor before making trading decisions. See our full Methodology and Disclaimer.
Common False Positives
Double Bottom is frequently misidentified. These are the most common invalid formations:
Double Bottom — Full Backtest Results
We tested 342 occurrences of the Double Bottom on BTC/USDT, ETH/USDT, SOL/USDT, and BNB/USDT using Binance historical OHLCV data from 2018 to 2026.