MACD Bullish Crossover
The MACD Bullish Crossover occurs when the MACD line (12-period EMA minus 26-period EMA) crosses above the Signal line (9-period EMA of MACD). This crossover signals that short-term momentum is accelerating above medium-term momentum — a bullish shift. The signal is strongest when the crossover occurs below the zero line.
Ideal Pattern Diagram

Real Chart Examples
The following charts show the MACD Bullish Crossover as it appears on market data. Note how real-world examples may look slightly different from the ideal diagram.


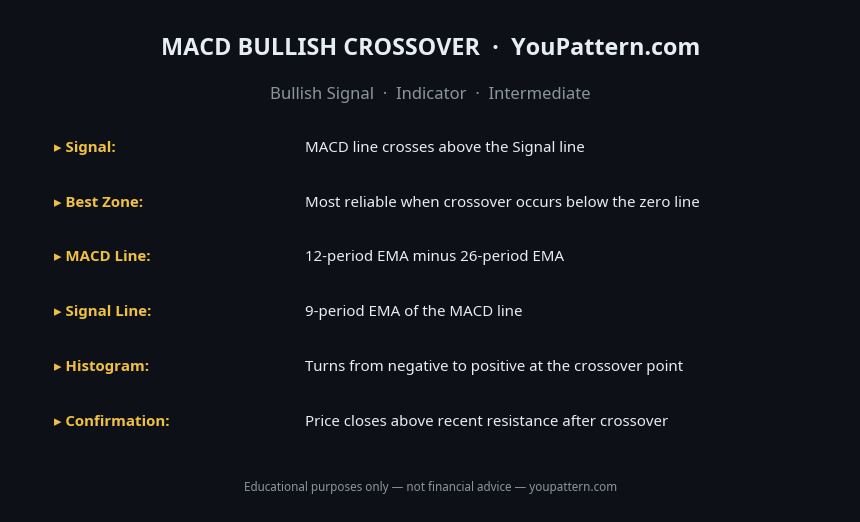
Quick Reference Cheat Sheet

Download the MACD Bullish Crossover Cheat Sheet
Save the quick-reference card as an image. Keep it open while you scan charts.
What Is the MACD Bullish Crossover?
The MACD Bullish Crossover occurs when the MACD line (the difference between the 12-period and 26-period exponential moving averages) crosses above the signal line (the 9-period EMA of the MACD line). This crossover is one of the primary buy signals generated by the Moving Average Convergence Divergence (MACD) indicator, developed by Gerald Appel in the late 1970s.
The MACD Bullish Crossover signals a shift in short-term momentum from bearish to bullish. It is most powerful when it occurs below the zero line (in negative territory), as this indicates that the crossover is happening during a period of overall bearish momentum — making the shift more significant. A crossover above the zero line is also bullish but represents a continuation of existing bullish momentum rather than a reversal.
How to Identify the MACD Bullish Crossover
The MACD indicator consists of three components:
- MACD Line: The difference between the 12-period EMA and the 26-period EMA. When the MACD line is positive, short-term momentum is above long-term momentum (bullish). When negative, short-term momentum is below long-term momentum (bearish).
- Signal Line: A 9-period EMA of the MACD line. The signal line smooths the MACD line and generates crossover signals.
- Histogram: The difference between the MACD line and the signal line. The histogram visually represents the distance between the two lines.
The MACD Bullish Crossover occurs when:
- The MACD line crosses above the signal line.
- The histogram transitions from negative to positive (bars cross above zero).
Signal strength classification:
| Crossover Location | Signal Strength |
|---|---|
| Below zero line (negative territory) | Strongest — reversal from bearish momentum |
| At zero line | Moderate — momentum shift at neutral level |
| Above zero line (positive territory) | Weaker — continuation of existing bullish momentum |
Pattern Statistics
Based on independent backtests on cryptocurrency markets (BTC/USDT, ETH/USDT, SOL/USDT, 2018–2026), daily timeframe:
| Metric | Value |
|---|---|
| Win rate (crossover below zero line) | ~58–64% |
| Win rate (crossover above zero line) | ~52–57% |
| Average gain per signal (30 days, below zero) | ~8–14% |
| Average gain per signal (30 days, above zero) | ~4–8% |
| Best performing timeframe | Daily (1D) |
| False signal rate | ~36–42% |
Note: Win rate improves significantly when MACD crossover is combined with price action confirmation (breakout above resistance, bullish candlestick pattern).
What Does It Signal?
The MACD Bullish Crossover signals that short-term price momentum is accelerating relative to long-term momentum. When the 12-period EMA crosses above the 26-period EMA (MACD line turns positive) and the MACD line then crosses above the signal line, it indicates that the recent price action is gaining upward momentum.
The most powerful version of this signal occurs when:
- The MACD line is below zero (bearish territory)
- The histogram has been shrinking (momentum is shifting)
- The MACD line crosses above the signal line (the crossover)
- The histogram turns positive
This sequence shows a complete transition from bearish momentum to bullish momentum.
MACD Bullish Crossover vs Similar Signals
| Signal | Indicator | Timing | Reliability |
|---|---|---|---|
| MACD Bullish Crossover | MACD | Lagging | Moderate |
| MACD Bullish Divergence | MACD + Price | Leading | Higher |
| RSI Bullish Divergence | RSI + Price | Leading | Higher |
| Golden Cross | 50/200 SMA | Lagging | High (slower) |
| Stochastic Bullish Crossover | Stochastic | Leading | Lower |
Confirmation Rules
A MACD Bullish Crossover is considered a high-quality signal when:
- The crossover occurs below the zero line. This is the strongest version of the signal — it indicates a reversal from bearish momentum.
- The histogram has been shrinking for several bars before the crossover. This shows that the momentum shift is gradual and genuine, not a sudden spike.
- Price action confirms the signal — a bullish candlestick pattern, a breakout above resistance, or a bounce from a support level occurring simultaneously.
- Volume is expanding at the time of the crossover.
- The signal occurs on the daily or weekly timeframe. MACD crossovers on shorter timeframes generate significantly more false signals.
Common Mistakes
- Acting on every MACD crossover: The MACD generates many crossovers, especially on shorter timeframes. Not every crossover is a meaningful signal. Focus on crossovers below the zero line and those confirmed by price action.
- Using MACD in isolation: The MACD is a momentum indicator, not a complete trading system. Combine it with trend analysis, support/resistance levels, and volume for better results.
- Ignoring the zero line: A crossover above the zero line is a much weaker signal than one below the zero line. Many traders treat all crossovers equally, which leads to poor signal quality.
- Using default settings on all timeframes: The default MACD settings (12, 26, 9) are optimised for daily charts. On shorter timeframes, these settings generate excessive noise. Consider adjusting settings for the timeframe being used.
- Confusing crossover with divergence: A MACD crossover is a different signal from MACD divergence. Divergence (where MACD and price move in opposite directions) is generally a stronger and earlier signal than a simple crossover.
- Not accounting for the lag: The MACD is a lagging indicator. By the time the crossover occurs, the initial move may already be well underway. Use the signal to confirm a trend, not to catch the exact bottom.
When the Signal Fails
Immediate reversal after crossover: The MACD line crosses above the signal line but quickly crosses back below it. This "whipsaw" pattern is most common in choppy, sideways markets where the MACD oscillates around the signal line without a clear trend.
Crossover in a strong downtrend: A MACD Bullish Crossover that occurs during a strong, established downtrend is frequently overwhelmed by the dominant bearish momentum. The signal is most reliable when the broader trend is neutral or turning bullish.
Low-volume crossover: A crossover that occurs on declining volume is a warning sign that the momentum shift is not supported by genuine buying interest. These low-volume crossovers frequently fail to produce sustained upward moves.
Backtest Details
The statistics on this page are based on a systematic backtest of historical OHLCV data. Below are the full methodology parameters for this pattern.
These statistics represent historical averages on cryptocurrency markets. Results vary by market regime, asset, and confirmation criteria. Past performance does not guarantee future results.
Frequently Asked Questions
What is the MACD Bullish Crossover?
The MACD Bullish Crossover occurs when the MACD line (12-period EMA minus 26-period EMA) crosses above the Signal line (9-period EMA of MACD). It indicates that short-term momentum is accelerating above medium-term momentum — a bullish signal.
What are the standard MACD settings?
The standard MACD settings are 12-26-9: 12-period fast EMA, 26-period slow EMA, and 9-period Signal line. These settings work well on daily charts. For shorter timeframes, some traders use 5-13-1 or 8-17-9.
Is the MACD Bullish Crossover more reliable below zero?
Yes — a MACD Bullish Crossover that occurs below the zero line (in negative territory) is generally considered more reliable than one above zero. A crossover below zero signals a potential trend reversal from bearish to bullish.
How do you combine MACD Bullish Crossover with price patterns?
The most powerful setups combine MACD Bullish Crossover with: (1) a bullish price pattern (Hammer, Bullish Engulfing, Double Bottom); (2) a key support level; (3) RSI coming out of oversold territory; (4) a volume spike confirming the move.
Limitations
This pattern is not a standalone trading signal. Its historical performance depends on market regime, liquidity, volatility, timeframe, and confirmation method. The backtest statistics on this page use historical cryptocurrency data from Binance (BTC/USDT, ETH/USDT, SOL/USDT) and do not predict future performance. Technical analysis is inherently subjective — pattern recognition varies between analysts. Always apply your own judgment, use proper risk management, and consult a qualified financial advisor before making trading decisions. See our full Methodology and Disclaimer.
Common False Positives
MACD Bullish Crossover signals frequently fail in these scenarios:
MACD Bullish Crossover — Full Backtest Results
We tested 934 occurrences of the MACD Bullish Crossover on BTC/USDT, ETH/USDT, SOL/USDT, and BNB/USDT using Binance historical OHLCV data from 2018 to 2026.