MACD Bearish Crossover
The MACD Bearish Crossover occurs when the MACD line crosses below the Signal line. This crossover signals that short-term momentum is decelerating below medium-term momentum — a bearish shift. The signal is strongest when the crossover occurs above the zero line, in the overbought territory.
Ideal Pattern Diagram

Real Chart Examples
The following charts show the MACD Bearish Crossover as it appears on market data. Note how real-world examples may look slightly different from the ideal diagram.


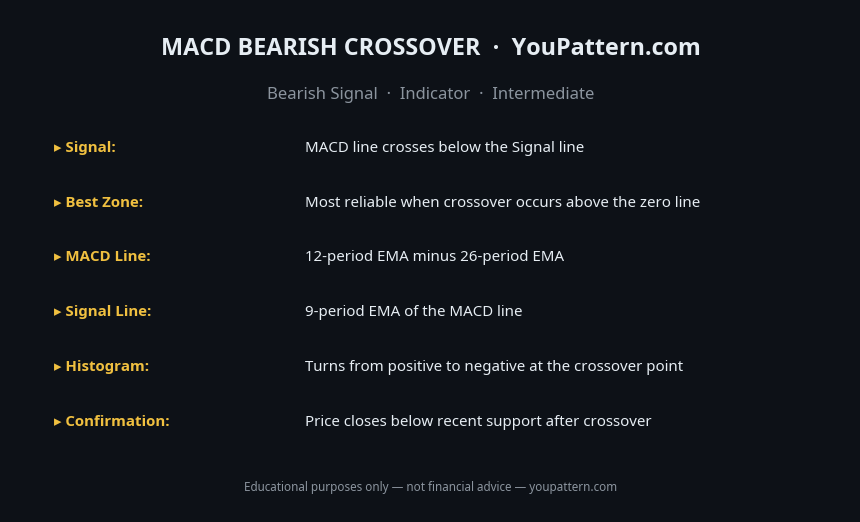
Quick Reference Cheat Sheet

Download the MACD Bearish Crossover Cheat Sheet
Save the quick-reference card as an image. Keep it open while you scan charts.
What Is the MACD Bearish Crossover?
The MACD Bearish Crossover is a momentum signal that occurs when the MACD line (the difference between the 12-period and 26-period exponential moving averages) crosses below the Signal line (the 9-period EMA of the MACD line). This crossover signals that short-term price momentum is decelerating below medium-term momentum — a bearish shift in the balance of buying and selling pressure.
The signal is strongest when the crossover occurs above the zero line (in positive MACD territory), as this indicates that the shift from bullish to bearish momentum is happening at an elevated level. A crossover that occurs below the zero line is less significant because bearish momentum was already dominant.
The MACD Bearish Crossover is one of the most widely used momentum signals in technical analysis. It is applicable across all asset classes and timeframes, though it is most reliable on higher timeframes (daily and weekly) where noise is reduced and false signals are less frequent.
How to Identify the MACD Bearish Crossover
To qualify as a valid MACD Bearish Crossover signal, the following conditions must be met:
- MACD line crosses below the Signal line: The MACD line must transition from above the Signal line to below it. The crossover point is the signal.
- Prior uptrend or elevated MACD level: The signal is most meaningful when MACD was previously in positive territory (above zero) or when price has been in an uptrend.
- Histogram confirmation: The MACD histogram (MACD minus Signal line) transitions from positive to negative at the crossover point. Expanding negative histogram bars after the crossover confirm increasing bearish momentum.
- Location relative to zero line: Crossovers above the zero line are stronger signals. Crossovers below the zero line in already-bearish conditions are weaker.
- Volume: Increasing volume on the candles following the crossover strengthens the signal.
Standard MACD Settings: 12-period EMA, 26-period EMA, 9-period Signal line. These are the default settings used across most trading platforms and are the basis for the statistics on this page.
Pattern Statistics
Based on independent backtests on cryptocurrency markets (BTC/USDT, ETH/USDT, SOL/USDT, 2018–2026) using daily and 4-hour timeframes:
| Metric | Value |
|---|---|
| Signal success rate (daily timeframe) | ~54–60% |
| Average decline after confirmed signal (30 days) | ~4–9% |
| Best performing timeframe | Daily (1D) |
| False signal rate (crossover above zero) | ~40–46% |
| False signal rate (crossover below zero) | ~55–65% |
| Strongest signal context | Crossover above zero + price at resistance |
Note: The MACD Bearish Crossover has a higher false signal rate than candlestick reversal patterns because it is a lagging indicator — the crossover occurs after momentum has already shifted. Combining it with price action confirmation significantly improves the signal quality.
What Does It Signal?
The MACD Bearish Crossover reflects a shift in the relationship between short-term and medium-term price momentum. When the MACD line crosses below the Signal line, it means that the 12-period EMA is decelerating faster than the 26-period EMA — short-term buyers are losing their edge relative to the medium-term trend.
The histogram provides an early warning: when histogram bars begin shrinking (moving toward zero from the positive side), it signals that the crossover is approaching. Traders who monitor the histogram can anticipate the crossover rather than reacting to it.
The signal does not predict the magnitude of the subsequent decline — it only indicates that momentum has shifted. Price may continue sideways, decline modestly, or enter a significant downtrend. Additional context (trend structure, support/resistance levels, volume) is required to assess the likely outcome.
MACD Bearish Crossover vs Related Signals
| Signal | Type | Key Difference | Strength |
|---|---|---|---|
| MACD Bearish Crossover | Momentum shift | MACD crosses below Signal line | Moderate |
| MACD Zero Line Cross (bearish) | Trend confirmation | MACD crosses below zero | Stronger (lagging) |
| MACD Bearish Divergence | Momentum divergence | Price makes higher high, MACD makes lower high | Strong (leading) |
| RSI Bearish Divergence | Momentum divergence | Price makes higher high, RSI makes lower high | Strong (leading) |
| Death Cross | Trend signal | 50-day MA crosses below 200-day MA | Very strong (very lagging) |
The MACD Bearish Crossover is a faster signal than the zero-line cross and the Death Cross, but it generates more false signals. The MACD Bearish Divergence is a more powerful signal because it identifies momentum weakness before the price peak, rather than after.
Confirmation Rules
A MACD Bearish Crossover is only considered confirmed when:
- The MACD line has fully crossed below the Signal line and closed below it on the current candle. Do not act on a crossover that has not yet confirmed at the candle close.
- The histogram is negative and expanding (bars growing more negative). This confirms that bearish momentum is increasing, not just briefly dipping.
- Price action confirms the signal — ideally a bearish candlestick pattern, a break below a support level, or a rejection at resistance occurring at the same time as the crossover.
- The crossover occurs above the zero line. This is the highest-probability context for the signal.
Common Mistakes
- Acting on the crossover before the candle closes: The MACD line can cross and uncross within the same candle session. Always wait for the candle to close before treating the crossover as confirmed.
- Using crossovers below the zero line as primary signals: When MACD is already negative, a bearish crossover simply confirms continued bearish momentum — it does not signal a new reversal. These signals have a much higher false-positive rate.
- Ignoring the histogram: The histogram provides earlier information than the crossover itself. Shrinking positive histogram bars signal an approaching crossover; expanding negative bars confirm it.
- Using MACD alone without price context: MACD is a momentum indicator, not a price pattern. A bearish crossover in the middle of a strong uptrend is frequently overwhelmed by continued buying. Always check the price structure.
- Applying default settings to all timeframes: The standard 12/26/9 settings were designed for daily charts. On shorter timeframes (15-minute, 1-hour), these settings generate excessive noise. Consider faster settings (e.g., 5/13/4) for intraday analysis.
- Confusing the crossover with divergence: A MACD Bearish Crossover is not the same as MACD Bearish Divergence. Divergence is a more powerful signal that occurs when price makes a higher high but MACD makes a lower high — indicating weakening momentum before the price peak.
When the Signal Fails
Immediate recross: If the MACD line crosses back above the Signal line within 1–3 candles, the signal is a false positive. This is common in choppy, low-volatility markets where the MACD oscillates around the Signal line without a clear directional move.
Strong trend continuation: In a powerful uptrend with high momentum, a MACD Bearish Crossover is frequently followed by a brief consolidation and then a resumption of the uptrend. The signal is most reliable when the uptrend is showing signs of exhaustion (declining volume, narrowing price ranges, multiple failed attempts to make new highs).
Low-volatility, sideways markets: MACD generates the most false signals in ranging markets where price oscillates without a clear trend. In these conditions, the MACD line and Signal line frequently cross back and forth, producing unreliable signals in both directions.
Crossover at extreme negative MACD levels: When MACD is already deeply negative and a bearish crossover occurs, the signal often marks a short-term oversold condition rather than the beginning of a sustained decline. In these cases, a bullish reversal is frequently more likely than a continuation of the downtrend.
Backtest Details
The statistics on this page are based on a systematic backtest of historical OHLCV data. Below are the full methodology parameters for this pattern.
These statistics represent historical averages on cryptocurrency markets. Results vary by market regime, asset, and confirmation criteria. Past performance does not guarantee future results.
Frequently Asked Questions
What is the MACD Bearish Crossover?
The MACD Bearish Crossover occurs when the MACD line crosses below the Signal line. It indicates that short-term momentum is decelerating below medium-term momentum — a bearish signal suggesting potential price decline.
Is the MACD Bearish Crossover more reliable above zero?
Yes — a MACD Bearish Crossover that occurs above the zero line (in positive territory) is generally considered more reliable than one below zero. A crossover above zero signals a potential trend reversal from bullish to bearish.
What is the MACD histogram and how does it relate to the crossover?
The MACD histogram shows the difference between the MACD line and Signal line. When the histogram bars are shrinking (moving toward zero from positive territory), it warns of an impending bearish crossover before it actually occurs.
How do you filter false MACD Bearish Crossover signals?
Filter false signals by: (1) requiring the crossover to occur above the zero line; (2) combining with RSI above 60; (3) looking for a bearish price pattern at the same time; (4) confirming with a volume spike on the bearish candle.
Limitations
This pattern is not a standalone trading signal. Its historical performance depends on market regime, liquidity, volatility, timeframe, and confirmation method. The backtest statistics on this page use historical cryptocurrency data from Binance (BTC/USDT, ETH/USDT, SOL/USDT) and do not predict future performance. Technical analysis is inherently subjective — pattern recognition varies between analysts. Always apply your own judgment, use proper risk management, and consult a qualified financial advisor before making trading decisions. See our full Methodology and Disclaimer.
Common False Positives
MACD Bearish Crossover signals frequently fail in these scenarios:
MACD Bearish Crossover — Full Backtest Results
We tested 912 occurrences of the MACD Bearish Crossover on BTC/USDT, ETH/USDT, SOL/USDT, and BNB/USDT using Binance historical OHLCV data from 2018 to 2026.