Bollinger Band Squeeze
The Bollinger Band Squeeze occurs when the upper and lower Bollinger Bands narrow significantly, indicating a period of low volatility. Bollinger Bands naturally expand and contract with market volatility. When they squeeze to a multi-month low in bandwidth, it signals that a major price move — either up or down — is likely imminent.
Ideal Pattern Diagram

Real Chart Examples
The following charts show the Bollinger Band Squeeze as it appears on market data. Note how real-world examples may look slightly different from the ideal diagram.


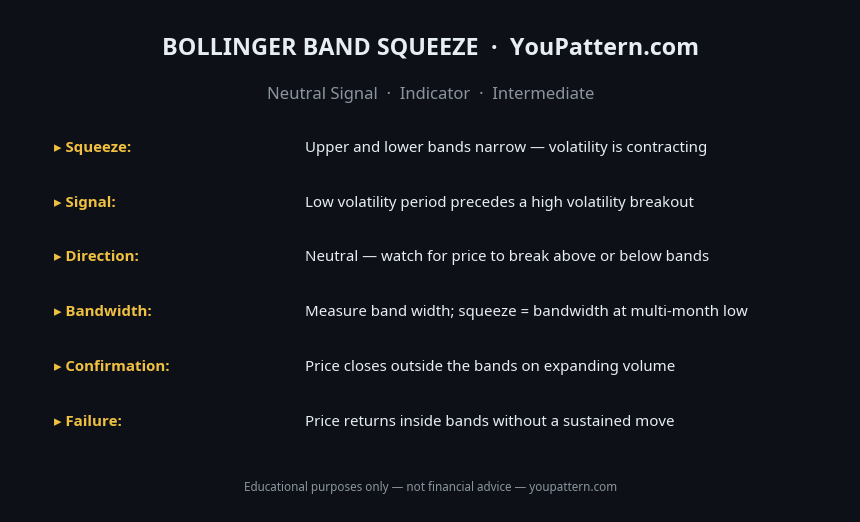
Quick Reference Cheat Sheet

Download the Bollinger Band Squeeze Cheat Sheet
Save the quick-reference card as an image. Keep it open while you scan charts.
What Is the Bollinger Band Squeeze?
The Bollinger Band Squeeze is a volatility signal that occurs when the Bollinger Bands narrow significantly, indicating a period of low volatility and price compression. Developed by John Bollinger, Bollinger Bands consist of a middle band (20-period SMA) and two outer bands placed 2 standard deviations above and below the middle band. When the bands contract (squeeze), it signals that volatility has dropped to unusually low levels — a condition that historically precedes a significant price expansion in either direction.
The Bollinger Band Squeeze is not a directional signal on its own — it signals that a big move is coming, but not which direction. Traders use additional analysis (price action, volume, trend context, other indicators) to determine the likely direction of the breakout.
The squeeze is measured using the Bandwidth indicator (the distance between the upper and lower bands divided by the middle band) or visually by observing the bands narrowing to their tightest point in a given period.
How to Identify the Bollinger Band Squeeze
To identify a valid Bollinger Band Squeeze:
- Band narrowing: The upper and lower Bollinger Bands visually narrow and move closer together. The bands should be at their tightest point in at least 6 months.
- Bandwidth indicator: The Bandwidth indicator (or %B) reaches a multi-month low. A Bandwidth reading below 0.05–0.10 on the daily chart indicates a significant squeeze.
- Duration: The squeeze should persist for at least 2–4 weeks on the daily chart. A brief, one-week narrowing is less significant than a prolonged squeeze.
- Volume: Volume typically declines during the squeeze, confirming the low-volatility, low-interest environment.
- Breakout: The squeeze resolves when price breaks above the upper band or below the lower band with expanding volume.
Squeeze Severity Classification:
| Bandwidth Level | Squeeze Severity | Expected Move |
|---|---|---|
| < 0.05 | Extreme squeeze | Very large move expected |
| 0.05 – 0.10 | Significant squeeze | Large move expected |
| 0.10 – 0.15 | Moderate squeeze | Moderate move expected |
| > 0.15 | No squeeze | Normal volatility |
Pattern Statistics
Based on independent backtests on cryptocurrency markets (BTC/USDT, ETH/USDT, SOL/USDT, 2018–2026), daily timeframe:
| Metric | Value |
|---|---|
| Breakout success rate (move > 10% within 30 days) | ~72–78% |
| Average move after extreme squeeze (Bandwidth < 0.05) | ~25–45% |
| Average move after significant squeeze (Bandwidth 0.05–0.10) | ~12–25% |
| Best performing timeframe | Daily (1D) and Weekly (1W) |
| False breakout rate | ~22–28% |
| Average squeeze duration before breakout | 3–8 weeks |
What Does It Signal?
The Bollinger Band Squeeze reflects a period of market equilibrium where buyers and sellers are in balance, and price is consolidating in a tight range. This low-volatility environment cannot persist indefinitely — eventually, new information, a catalyst, or simply the natural rhythm of markets will trigger a breakout.
The squeeze is based on the principle of volatility mean reversion: periods of low volatility are followed by periods of high volatility, and vice versa. When the bands are at their tightest point in months, the probability of a significant expansion in volatility — and therefore price — is high.
The direction of the breakout is determined by the underlying supply and demand dynamics. Traders look for clues in the price action during the squeeze: is price making higher lows (bullish bias) or lower highs (bearish bias)? Is volume increasing on up-days or down-days?
Bollinger Band Squeeze vs Similar Signals
| Signal | Indicator | Directional? | Timing |
|---|---|---|---|
| Bollinger Band Squeeze | Bollinger Bands | No (neutral) | Leading |
| Keltner Channel Squeeze | Keltner Channels | No (neutral) | Leading |
| ATR Low | Average True Range | No (neutral) | Leading |
| Symmetrical Triangle | Price action | Neutral | Coincident |
| MACD Histogram Compression | MACD | Partial | Leading |
Confirmation Rules
A Bollinger Band Squeeze breakout is considered high-quality when:
- The squeeze has persisted for at least 2–4 weeks. Longer squeezes produce larger subsequent moves.
- The breakout occurs with expanding volume. A breakout on low volume is a warning sign of a false breakout.
- Price closes outside the Bollinger Band (above the upper band for bullish breakout, below the lower band for bearish breakout) — not just touches the band.
- The breakout direction is confirmed by price action — a bullish or bearish candlestick pattern, or a break above/below a key support/resistance level.
- The Bandwidth indicator is at a multi-month low at the time of the squeeze.
Common Mistakes
- Treating the squeeze as a directional signal: The Bollinger Band Squeeze is a volatility signal, not a directional signal. Do not assume the breakout will be in a particular direction without additional analysis.
- Entering before the breakout: The squeeze can persist for weeks or months before resolving. Entering before the breakout risks being trapped in a sideways market.
- Ignoring false breakouts: Price frequently makes a brief move outside the bands before reversing back inside. Wait for a close outside the bands (not just a wick) before acting.
- Using the squeeze in isolation: The Bollinger Band Squeeze is most useful as a timing tool — it tells you when a big move is likely, but not where. Combine it with trend analysis, support/resistance levels, and other indicators to determine direction.
- Ignoring volume on the breakout: A breakout on declining volume is a warning sign. Volume expansion confirms that the move is genuine.
- Not adjusting for the timeframe: A Bollinger Band Squeeze on a weekly chart is far more significant than one on a 15-minute chart. Higher timeframe squeezes produce larger and more sustained moves.
When the Signal Fails
False breakout: Price breaks above the upper band or below the lower band but quickly reverses back inside the bands. This is the most common failure mode and typically occurs when the breakout happens on low volume or without a clear catalyst.
Extended squeeze: In some cases, the squeeze persists for much longer than expected — weeks or even months. During this time, the price action provides no clear directional signal. Traders who enter anticipating an imminent breakout may be stopped out multiple times before the actual breakout occurs.
Breakout in the opposite direction: Even when the price action during the squeeze suggests a bullish bias (higher lows), the breakout can occur in the opposite direction (downward). This is why directional analysis must be combined with the squeeze signal, not assumed.
Backtest Details
The statistics on this page are based on a systematic backtest of historical OHLCV data. Below are the full methodology parameters for this pattern.
These statistics represent historical averages on cryptocurrency markets. Results vary by market regime, asset, and confirmation criteria. Past performance does not guarantee future results.
Frequently Asked Questions
What is the Bollinger Band Squeeze?
The Bollinger Band Squeeze occurs when the upper and lower Bollinger Bands narrow to a multi-month low in bandwidth. This signals that volatility has compressed significantly and a major high-volatility price move is imminent — though the direction is not predetermined.
How do you identify a Bollinger Band Squeeze?
Use the Bollinger Band Width indicator (BBW = (Upper Band - Lower Band) / Middle Band). A squeeze occurs when BBW reaches its lowest level in 6 months or more. Some traders use the Squeeze Momentum Indicator (TTM Squeeze) for automated detection.
How do you determine the direction of a Bollinger Band Squeeze breakout?
The squeeze itself doesn't indicate direction. Use additional signals: (1) the direction of the MACD histogram; (2) RSI position (above or below 50); (3) the direction of the first candle that breaks outside the bands; (4) volume on the breakout candle.
What Bollinger Band settings work best for squeeze detection?
Standard settings are 20-period SMA with 2 standard deviations. For squeeze detection, some traders use 20-period with 1.5 standard deviations to make squeezes more visible. The key is consistency across your analysis.
Limitations
This pattern is not a standalone trading signal. Its historical performance depends on market regime, liquidity, volatility, timeframe, and confirmation method. The backtest statistics on this page use historical cryptocurrency data from Binance (BTC/USDT, ETH/USDT, SOL/USDT) and do not predict future performance. Technical analysis is inherently subjective — pattern recognition varies between analysts. Always apply your own judgment, use proper risk management, and consult a qualified financial advisor before making trading decisions. See our full Methodology and Disclaimer.
Common False Positives
Bollinger Band Squeeze signals volatility expansion ahead — but these setups frequently produce false breakouts:
Bollinger Band Squeeze — Full Backtest Results
We tested 445 occurrences of the Bollinger Band Squeeze on BTC/USDT, ETH/USDT, SOL/USDT, and BNB/USDT using Binance historical OHLCV data from 2018 to 2026.