Hammer Candlestick Pattern
A single-candle reversal pattern with a small real body near the top and a long lower shadow at least twice the body's length. Appears at the bottom of downtrends and signals that sellers pushed prices down but buyers regained control before the close.
Ideal Pattern Diagram

Real Chart Examples
The following charts show the Hammer pattern as it appears on historical market data from Binance. Note how real-world examples may look slightly different from the ideal diagram.


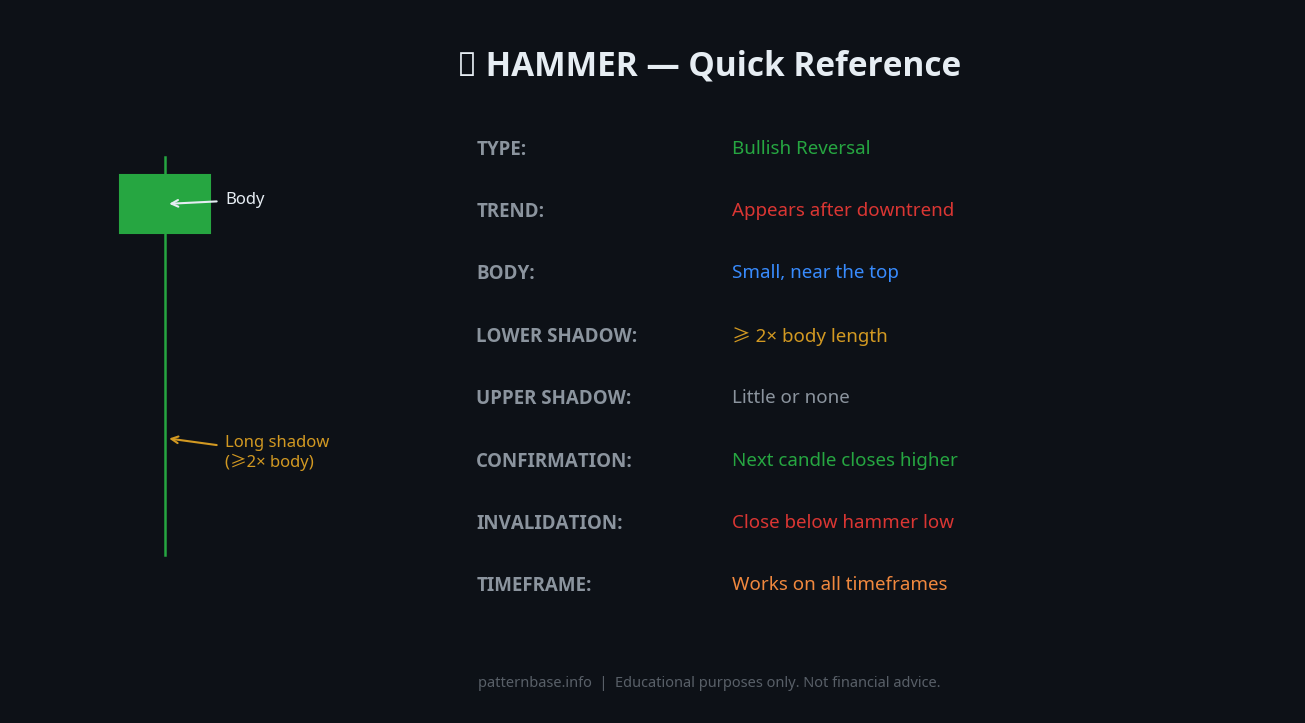
Quick Reference Cheat Sheet

Download the Hammer Cheat Sheet
Save the quick-reference card as an image. Keep it open while you scan charts.
What is the Hammer Candlestick Pattern?
The Hammer is a single-candle bullish reversal pattern that appears at the bottom of a downtrend. It is characterised by a small real body near the top of the candle's range, a long lower shadow that extends significantly below the body, and little to no upper shadow. The candle visually resembles a hammer driving a nail into a floor — hence the name. It can appear with either a green (bullish) or red (bearish) body, though a green body is generally considered a slightly stronger signal.
The pattern is most meaningful when it forms after a sustained price decline of at least three to five consecutive bearish candles, or after price has reached a recognisable support level such as a prior swing low, a round-number price zone, or a moving average. A hammer appearing in the middle of a trading range or during a sideways consolidation carries significantly less analytical weight and is frequently misread by newer traders.
The Hammer belongs to the same family as the Inverted Hammer, the Hanging Man, and the Shooting Star — all of which share similar structural geometry but carry different implications depending on where they appear in the trend. Context is the defining variable that separates a meaningful Hammer from a random candle shape.
How to Identify the Hammer Candlestick Pattern
To qualify as a valid Hammer, a candle must meet all of the following structural criteria:
- Lower shadow length: The lower shadow must be at least 2× the length of the real body. A ratio of 2.5× to 3× is considered a stronger signal.
- Upper shadow: Little to no upper shadow. The upper shadow should be no longer than 10–15% of the total candle range from low to high.
- Body position: The real body forms in the upper 25–30% of the candle's total range.
- Body colour: Either green or red is valid. A green (bullish close) body is marginally preferred as it shows buyers closed the session above the open.
- Trend context: The candle must appear after a prior downtrend. At minimum, price should have declined noticeably over the preceding 3–10 candles before the Hammer forms.
- Volume: Above-average volume on the Hammer candle strengthens the signal. Volume that is 1.5× or more the 20-period average is a meaningful supporting factor.
Pattern Statistics
Based on YouPattern's independent backtest (BTC/USDT, ETH/USDT, SOL/USDT, BNB/USDT — Binance historical OHLCV, 2018–2026) and third-party research by Thomas Bulkowski (Encyclopedia of Chart Patterns, 3rd ed., equity markets):
| Metric | Value |
|---|---|
| Confirmed reversal rate (daily timeframe) | ~60–65% |
| Average gain after confirmed signal (30 days) | ~4–7% |
| Best performing timeframe | Daily (1D) |
| Failure rate without confirmation candle | ~45% |
| Ideal shadow-to-body ratio | 2.5× – 3× |
| Minimum prior downtrend length | 3–5 candles |
Note: These statistics represent historical averages across multiple markets. Individual results vary significantly based on market conditions, asset liquidity, and confirmation criteria applied.
What Does It Signal?
The Hammer reflects a specific sequence of intraday market behaviour. During the session, sellers initially dominate and push price sharply lower, creating the long lower wick. However, buyers step in aggressively before the close and drive price back up toward the session's opening level, leaving the small body near the top of the range. This rejection of lower prices indicates that selling pressure is exhausting and that buyers are willing to defend a particular price zone.
The psychology behind the pattern is a shift in the balance of power. Sellers who held control throughout the prior downtrend fail to maintain their advantage during this candle's session. The longer the lower shadow relative to the body, the more dramatic that intraday rejection was, and the more clearly it signals that a price floor may be forming.
The Hammer does not confirm a reversal on its own — it signals the potential for one, which is why traders typically wait for a confirming candle before drawing conclusions.
Hammer vs Similar Patterns
| Pattern | Shape | Location | Signal |
|---|---|---|---|
| Hammer | Small body top, long lower shadow | Bottom of downtrend | Bullish reversal |
| Hanging Man | Same shape as Hammer | Top of uptrend | Bearish reversal |
| Inverted Hammer | Small body bottom, long upper shadow | Bottom of downtrend | Bullish reversal (weaker) |
| Shooting Star | Same shape as Inverted Hammer | Top of uptrend | Bearish reversal |
| Dragonfly Doji | No body, long lower shadow | Bottom of downtrend | Bullish reversal (strong) |
| Pin Bar | Same concept, used in Forex | Any trend | Reversal (context-dependent) |
The key distinction is always location in the trend. The same candle shape means completely different things at the top versus the bottom of a move.
Confirmation Rules
A Hammer is only considered confirmed when:
- The next candle closes above the Hammer's high. This is the primary confirmation signal and the most widely used entry trigger.
- Volume on the Hammer candle is above average. Ideally 1.5× the 20-period average volume or higher.
- The Hammer forms at or near a recognised support level — prior swing low, moving average, Fibonacci level, or round number.
Some traders also use a two-candle confirmation approach: they wait for two consecutive bullish closes above the Hammer's high before entering, which reduces false signals at the cost of a slightly higher entry price.
Common Mistakes
- Ignoring trend context: Identifying a Hammer in a sideways or uptrending market and treating it as a reversal signal. The pattern requires a prior downtrend to carry meaning.
- Skipping confirmation: Acting on the Hammer candle itself rather than waiting for the next candle to close above the Hammer's high. Many Hammers fail without this follow-through.
- Accepting a weak lower shadow: Treating any candle with a lower wick as a Hammer. If the lower shadow is less than 2× the body length, the structural requirement is not met.
- Overlooking the upper shadow: A candle with a long lower shadow and a significant upper shadow is an indecision candle (a spinning top or doji variant), not a Hammer. The near-absence of an upper shadow is a required criterion.
- Using it in isolation on low-liquidity assets: On thinly traded assets, single-candle patterns are far more susceptible to noise and manipulation. Applying Hammer analysis to low-volume altcoins or penny stocks without additional confirmation layers increases the rate of false signals substantially.
- Confusing with the Hanging Man: The shapes are identical. Always check whether the pattern appears at the bottom (Hammer) or top (Hanging Man) of a move before assigning a directional bias.
When the Pattern Fails
No follow-through on the next candle: If the candle immediately following the Hammer closes below the Hammer's low, the pattern is invalidated. This signals that sellers regained control and the attempted reversal was rejected.
Formation in a strong, accelerating downtrend: When price is in a steep, high-momentum decline — often visible through a sharp angle of descent and expanding bearish candles — a single Hammer is frequently overwhelmed by continued selling pressure. Patterns forming against a dominant trend without structural support beneath them carry a meaningfully higher failure rate.
Absence of a nearby support structure: A Hammer that forms in open price space, with no prior swing lows, moving averages, or volume-by-price nodes nearby, lacks the technical context that gives the pattern its analytical basis. The long lower shadow needs a reason to reject — without an underlying support level, the rejection is less meaningful.
Backtest Details
The statistics on this page are based on a systematic backtest of historical OHLCV data. Below are the full methodology parameters for this pattern.
These statistics represent historical averages on cryptocurrency markets. Results vary by market regime, asset, and confirmation criteria. Past performance does not guarantee future results.
Frequently Asked Questions
What is the Hammer candlestick pattern?
The Hammer is a single-candle bullish reversal pattern with a small real body near the top and a lower shadow at least twice the body's length. It appears at the bottom of downtrends and signals that sellers pushed prices down but buyers regained control before the close.
How do you identify a Hammer candlestick?
Look for: (1) a small real body in the upper third of the candle range; (2) a lower shadow at least 2× the body length; (3) little or no upper shadow; (4) appearance after a downtrend of at least 3–5 candles.
Is the Hammer pattern bullish or bearish?
The Hammer is a bullish reversal pattern. It signals that selling pressure is exhausting and buyers are beginning to take control, potentially reversing the prior downtrend.
What is the difference between a Hammer and a Hanging Man?
Both have the same shape — small body with a long lower shadow — but context is everything. A Hammer appears at the bottom of a downtrend (bullish signal), while a Hanging Man appears at the top of an uptrend (bearish signal).
Limitations
This pattern is not a standalone trading signal. Its historical performance depends on market regime, liquidity, volatility, timeframe, and confirmation method. The backtest statistics on this page use historical cryptocurrency data from Binance (BTC/USDT, ETH/USDT, SOL/USDT, BNB/USDT) and do not predict future performance. Technical analysis is inherently subjective — pattern recognition varies between analysts. Always apply your own judgment, use proper risk management, and consult a qualified financial advisor before making trading decisions. See our full Methodology and Disclaimer.
Common False Positives
Not every small-body candle with a long lower shadow is a valid Hammer. These are the most frequent misidentifications: