Shooting Star Pattern
The Shooting Star is a single-candle bearish reversal pattern that appears at the top of an uptrend. It has a small real body in the lower portion of the candle range and a long upper shadow at least twice the body length. The long upper shadow shows that buyers pushed prices higher during the session but sellers drove them back down before the close.
Ideal Pattern Diagram

Real Chart Examples
The following charts show the Shooting Star Pattern as it appears on market data. Note how real-world examples may look slightly different from the ideal diagram.


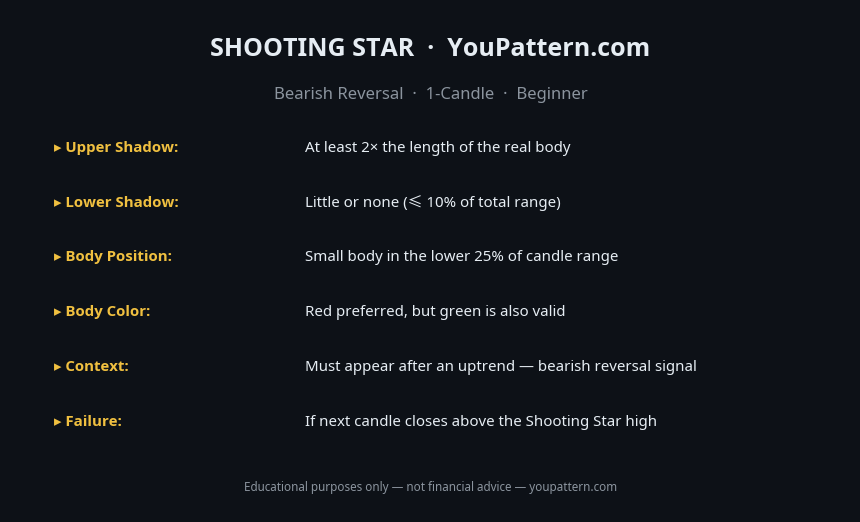
Quick Reference Cheat Sheet

Download the Shooting Star Pattern Cheat Sheet
Save the quick-reference card as an image. Keep it open while you scan charts.
What Is the Shooting Star Pattern?
The Shooting Star is a single-candle bearish reversal pattern that appears at the top of an uptrend. It is characterised by a small real body near the bottom of the candle's range, a long upper shadow that extends significantly above the body (at least 2× the body length), and little to no lower shadow. The candle visually resembles a shooting star falling from the sky — the long upper shadow represents the trail of the star.
The Shooting Star is the bearish counterpart of the Inverted Hammer. Both have the same shape — small body at the bottom with a long upper shadow — but their locations determine their meaning: an Inverted Hammer at the bottom of a downtrend is bullish; a Shooting Star at the top of an uptrend is bearish.
The long upper shadow tells a specific story: during the session, buyers pushed price significantly higher (creating the long upper shadow), but sellers overwhelmed them before the close and drove price back down near the session's open. This rejection of higher prices at the top of an uptrend is a warning that bullish momentum is failing.
How to Identify the Shooting Star Pattern
To qualify as a valid Shooting Star, a candle must meet all of the following criteria:
- Upper shadow length: The upper shadow must be at least 2× the length of the real body. A ratio of 2.5× to 3× is considered a stronger signal.
- Lower shadow: Little to no lower shadow. The lower shadow should be no longer than 10–15% of the total candle range.
- Body position: The real body forms in the lower 25–30% of the candle's total range.
- Body colour: Either green or red is valid. A red (bearish close) body is marginally preferred.
- Trend context: The candle must appear after a prior uptrend of at least 3–5 bullish candles.
- Volume: Above-average volume on the Shooting Star candle strengthens the signal.
Pattern Statistics
Based on quantitative research by Thomas Bulkowski (Encyclopedia of Chart Patterns, 3rd edition) and independent backtests on cryptocurrency markets (BTC/USDT, ETH/USDT, SOL/USDT, 2018–2026):
| Metric | Value |
|---|---|
| Confirmed reversal rate (daily timeframe) | ~58–64% |
| Average decline after confirmed signal (30 days) | ~4–8% |
| Best performing timeframe | Daily (1D) |
| Failure rate without confirmation candle | ~44% |
| Ideal shadow-to-body ratio | 2.5× – 3× |
| Minimum prior uptrend length | 3–5 candles |
What Does It Signal?
The Shooting Star reflects a failed attempt by buyers to push price higher. During the session, buyers drove price significantly above the open (creating the long upper shadow), but sellers stepped in aggressively and drove price all the way back down to near the open by the close. This intraday rejection of higher prices at the top of an uptrend is a direct signal that sellers are willing to defend a price level and that buyers are losing their ability to sustain the uptrend.
Shooting Star vs Similar Patterns
| Pattern | Shape | Location | Signal |
|---|---|---|---|
| Shooting Star | Small body bottom, long upper shadow | Top of uptrend | Bearish reversal |
| Inverted Hammer | Same shape as Shooting Star | Bottom of downtrend | Bullish reversal |
| Hanging Man | Small body top, long lower shadow | Top of uptrend | Bearish reversal (weaker) |
| Hammer | Same shape as Hanging Man | Bottom of downtrend | Bullish reversal |
| Bearish Engulfing | 2-candle pattern | Top of uptrend | Bearish reversal (stronger) |
| Gravestone Doji | No body, long upper shadow | Top of uptrend | Bearish reversal (strong) |
The Gravestone Doji is the strongest variant of the Shooting Star — when the open and close are identical (no body), the rejection of higher prices is even more decisive.
Confirmation Rules
A Shooting Star is considered confirmed when:
- The next candle closes below the Shooting Star's low. This is the primary confirmation signal — sellers follow through and drive price below the session's low.
- Volume on the Shooting Star candle is above average. High volume indicates that the intraday rejection was not just noise but represented meaningful selling pressure.
- The Shooting Star forms at or near a recognised resistance level — prior swing high, moving average, Fibonacci level, or round-number price zone.
Common Mistakes
- Confusing with the Inverted Hammer: The shapes are identical — always check the trend context. An Inverted Hammer is at the bottom of a downtrend (bullish). A Shooting Star is at the top of an uptrend (bearish).
- Skipping confirmation: Many Shooting Stars fail without follow-through. Always wait for the next candle to close below the Shooting Star's low.
- Accepting a weak upper shadow: If the upper shadow is less than 2× the body length, the structural requirement is not met.
- Ignoring the lower shadow: A candle with a long upper shadow and a significant lower shadow is an indecision candle, not a Shooting Star. The near-absence of a lower shadow is required.
- Using it in isolation: The Shooting Star is most reliable when combined with other bearish signals — resistance levels, declining volume on the prior uptrend, or bearish divergence on RSI/MACD.
- Treating a green Shooting Star as bullish: A green (bullish close) Shooting Star is still a bearish reversal signal in the context of an uptrend. The colour of the body is secondary to the trend context.
When the Pattern Fails
No follow-through on the next candle: If the candle immediately following the Shooting Star closes above the Shooting Star's high, the pattern is invalidated. Buyers regained control and the attempted reversal was rejected.
Formation in a strong, accelerating uptrend: When price is in a steep, high-momentum advance, a single Shooting Star is frequently overwhelmed by continued buying pressure. The pattern is most reliable when the uptrend is showing signs of exhaustion.
Absence of a nearby resistance structure: A Shooting Star that forms in open price space, with no prior swing highs or resistance levels nearby, lacks the technical context that gives the pattern its analytical basis.
Backtest Details
The statistics on this page are based on a systematic backtest of historical OHLCV data. Below are the full methodology parameters for this pattern.
These statistics represent historical averages on cryptocurrency markets. Results vary by market regime, asset, and confirmation criteria. Past performance does not guarantee future results.
Frequently Asked Questions
What is the Shooting Star candlestick pattern?
The Shooting Star is a single-candle bearish reversal pattern at the top of an uptrend. It has a long upper shadow (at least 2× the body), a small real body near the bottom of the candle range, and little or no lower shadow.
What is the difference between a Shooting Star and an Inverted Hammer?
Both have the same shape — small body with a long upper shadow — but context differs. A Shooting Star appears at the top of an uptrend (bearish signal), while an Inverted Hammer appears at the bottom of a downtrend (bullish signal).
How do you confirm a Shooting Star?
Wait for the next candle to close below the Shooting Star's body. Additional confirmation: high volume on the Shooting Star, RSI above 70 (overbought), key resistance level, or bearish divergence on RSI/MACD.
Is a red Shooting Star more bearish than a green one?
Yes — a red (bearish) Shooting Star where the close is below the open is considered slightly more bearish than a green one. However, the long upper shadow is the primary signal regardless of body colour.
Limitations
This pattern is not a standalone trading signal. Its historical performance depends on market regime, liquidity, volatility, timeframe, and confirmation method. The backtest statistics on this page use historical cryptocurrency data from Binance (BTC/USDT, ETH/USDT, SOL/USDT) and do not predict future performance. Technical analysis is inherently subjective — pattern recognition varies between analysts. Always apply your own judgment, use proper risk management, and consult a qualified financial advisor before making trading decisions. See our full Methodology and Disclaimer.
Common False Positives
Shooting Star is frequently confused with Inverted Hammer. Context is the only distinction:
Shooting Star — Full Backtest Results
We tested 756 occurrences of the Shooting Star on BTC/USDT, ETH/USDT, SOL/USDT, and BNB/USDT using Binance historical OHLCV data from 2018 to 2026.