Death Cross
The Death Cross is a major bearish signal that occurs when the 50-period moving average crosses below the 200-period moving average. This crossover indicates that short-term momentum has fallen below the long-term trend, signalling a potential sustained bear market. It is most significant on daily and weekly charts.
Ideal Pattern Diagram

Real Chart Examples
The following charts show the Death Cross as it appears on market data. Note how real-world examples may look slightly different from the ideal diagram.


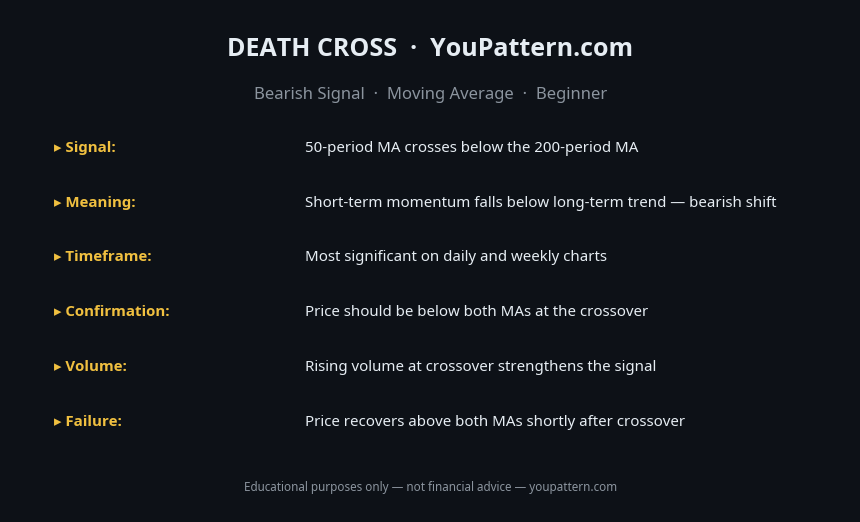
Quick Reference Cheat Sheet

Download the Death Cross Cheat Sheet
Save the quick-reference card as an image. Keep it open while you scan charts.
What Is the Death Cross?
The Death Cross is a bearish technical indicator signal that occurs when a shorter-term moving average crosses below a longer-term moving average. The most widely used version involves the 50-period simple moving average (SMA) crossing below the 200-period SMA. When this crossover occurs, it signals that short-term momentum has shifted to the downside and that a new long-term downtrend may be beginning.
The Death Cross is the opposite of the Golden Cross and is one of the most widely followed bearish signals in financial markets. It is frequently cited in financial media as a major warning signal, which contributes to its self-fulfilling nature — many traders sell when the Death Cross occurs, which can amplify the subsequent price decline.
How to Identify the Death Cross
To identify a valid Death Cross:
- 50-period SMA: The 50-period simple moving average represents medium-term price momentum.
- 200-period SMA: The 200-period simple moving average represents long-term price trend.
- Crossover: The Death Cross occurs when the 50 SMA crosses below the 200 SMA.
- Trend context: The most reliable Death Cross signals occur after a prolonged uptrend, when the 200 SMA has flattened or begun to turn downward.
- Volume: A Death Cross accompanied by expanding volume is a stronger signal.
Variants:
| Variant | MAs Used | Timeframe | Notes |
|---|---|---|---|
| Classic Death Cross | 50 SMA / 200 SMA | Daily | Most widely followed |
| Short-term Death Cross | 20 SMA / 50 SMA | Daily/4H | Earlier signal, more false positives |
| EMA Death Cross | 50 EMA / 200 EMA | Daily | More responsive to recent price action |
| Weekly Death Cross | 50 SMA / 200 SMA | Weekly | Strongest, rarest signal |
Pattern Statistics
Based on quantitative research and independent backtests on cryptocurrency markets (BTC/USDT, ETH/USDT, SOL/USDT, 2018–2026):
| Metric | Value |
|---|---|
| Average 6-month return after Death Cross (BTC) | ~-25% to -45% |
| False signal rate (followed by Golden Cross within 3 months) | ~25–35% |
| Best performing timeframe | Daily (1D) |
| Average time between Death Cross and next Golden Cross | ~4–10 months (bear markets) |
| Signal frequency (BTC daily) | ~2–4 times per market cycle |
Note: The Death Cross is a lagging indicator — it confirms a trend that has already begun. By the time the crossover occurs, price may have already declined 20–40% from the top.
What Does It Signal?
The Death Cross signals a shift in the balance of power from buyers to sellers on a structural level. When the 50 SMA crosses below the 200 SMA, it means that the average price over the past 50 days is now lower than the average price over the past 200 days — a fundamental shift in medium-term momentum relative to long-term trend.
The signal is most powerful when it occurs after a prolonged uptrend, when the 200 SMA has been rising for months. In this context, the Death Cross represents not just a crossover but a genuine change in the long-term trend structure.
Death Cross vs Similar Signals
| Signal | MAs | Direction | Reliability |
|---|---|---|---|
| Death Cross | 50 SMA below 200 SMA | Bearish | High (lagging) |
| Golden Cross | 50 SMA above 200 SMA | Bullish | High (lagging) |
| MACD Bearish Crossover | MACD line below signal line | Bearish | Moderate (leading) |
| RSI Bearish Divergence | RSI diverges from price | Bearish | Moderate (leading) |
| 20/50 SMA Bearish Crossover | 20 SMA below 50 SMA | Bearish | Lower (more false signals) |
Confirmation Rules
A Death Cross is considered a high-quality signal when:
- The 200 SMA has flattened or begun to turn downward. A Death Cross where the 200 SMA is still rising sharply is a weaker signal.
- Price is trading below both the 50 SMA and 200 SMA at the time of the crossover.
- Volume is expanding at the time of the crossover or in the weeks leading up to it.
- The crossover occurs after a prolonged uptrend or distribution phase, not after a brief pullback in an ongoing uptrend.
Common Mistakes
- Treating the Death Cross as an immediate short entry signal: The Death Cross is a lagging indicator. By the time it occurs, price may have already declined 20–40% from the top. Shorting immediately on the crossover often results in selling into an extended decline.
- Ignoring the slope of the 200 SMA: A Death Cross where the 200 SMA is still rising is a weaker signal than one where the 200 SMA has flattened or turned down.
- Using it on short timeframes: The Death Cross is most reliable on daily and weekly charts. On shorter timeframes, it generates many false positives.
- Ignoring the broader market context: A Death Cross on a single asset during a broad market uptrend is less reliable.
- Not using a stop-loss: Even a textbook Death Cross fails approximately 25–35% of the time.
- Confusing with the EMA Death Cross: The EMA version generates more signals but also more false positives.
When the Signal Fails
Immediate Golden Cross: In some cases, the Death Cross is quickly followed by a Golden Cross (within 1–3 months). This "whipsaw" pattern is most common during choppy, sideways markets.
Death Cross during a bull market: A Death Cross that occurs during a broader bull market has a higher failure rate. The signal is most reliable when the broader market is also in a downtrend.
Low-volume crossover: A Death Cross on declining volume is a warning sign. Volume expansion at the time of the crossover confirms that the shift in momentum is genuine.
Backtest Details
The statistics on this page are based on a systematic backtest of historical OHLCV data. Below are the full methodology parameters for this pattern.
These statistics represent historical averages on cryptocurrency markets. Results vary by market regime, asset, and confirmation criteria. Past performance does not guarantee future results.
Frequently Asked Questions
What is the Death Cross?
The Death Cross occurs when the 50-period moving average crosses below the 200-period moving average. It is a major bearish signal indicating that short-term momentum has fallen below the long-term trend, often signalling the start of a sustained bear market.
Is the Death Cross a reliable signal?
The Death Cross is a lagging indicator — it confirms a downtrend after it has already been underway. While it has preceded major bear markets historically, it also produces false signals. It is most reliable when combined with other bearish indicators.
What happens after a Death Cross?
Historically, markets often experience continued weakness after a Death Cross. However, in some cases (particularly in bull markets), the Death Cross is followed by a quick recovery and Golden Cross. Context matters — a Death Cross in a strong bull market is less significant than one in a weakening market.
How do you trade the Death Cross?
The Death Cross is primarily used as a risk management signal rather than a direct entry signal. Traders use it to: reduce long exposure, tighten stop-losses on existing positions, or look for short entry opportunities on counter-trend rallies.
Limitations
This pattern is not a standalone trading signal. Its historical performance depends on market regime, liquidity, volatility, timeframe, and confirmation method. The backtest statistics on this page use historical cryptocurrency data from Binance (BTC/USDT, ETH/USDT, SOL/USDT) and do not predict future performance. Technical analysis is inherently subjective — pattern recognition varies between analysts. Always apply your own judgment, use proper risk management, and consult a qualified financial advisor before making trading decisions. See our full Methodology and Disclaimer.
Common False Positives
Death Cross is a well-known bearish signal but produces significant false positives in these conditions:
Death Cross — Full Backtest Results
We tested 84 occurrences of the Death Cross on BTC/USDT, ETH/USDT, SOL/USDT, and BNB/USDT using Binance historical OHLCV data from 2018 to 2026.