Cup and Handle Pattern
The Cup and Handle is a bullish continuation pattern first described by William O'Neil. It consists of a rounded U-shaped bottom (the cup) followed by a brief downward drift (the handle). The cup forms over weeks to months as price gradually declines and recovers. The handle is a short consolidation before the breakout above the cup's rim.
Ideal Pattern Diagram

Real Chart Examples
The following charts show the Cup and Handle Pattern as it appears on market data. Note how real-world examples may look slightly different from the ideal diagram.


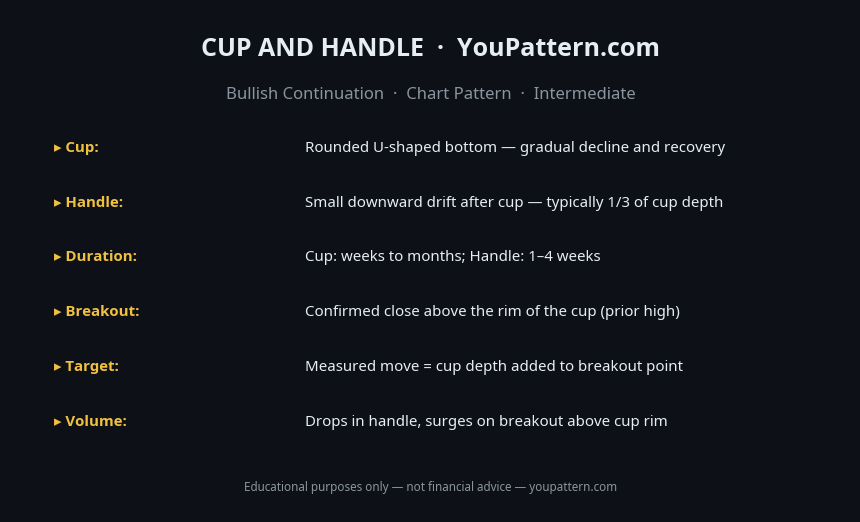
Quick Reference Cheat Sheet

Download the Cup and Handle Pattern Cheat Sheet
Save the quick-reference card as an image. Keep it open while you scan charts.
What Is the Cup and Handle Pattern?
The Cup and Handle is a bullish continuation pattern first described by William O'Neil in his 1988 book How to Make Money in Stocks. It consists of a rounded, U-shaped price decline and recovery (the "cup"), followed by a smaller consolidation or pullback (the "handle"), and then a breakout above the cup's rim. The pattern resembles the profile of a teacup viewed from the side.
The Cup and Handle is primarily a continuation pattern that forms during an uptrend. The cup represents a period of consolidation and accumulation, during which early investors who bought at the prior high gradually sell (creating the left side of the cup), and new buyers accumulate at lower prices (creating the right side). The handle is a brief pullback that shakes out weak holders before the final breakout.
The pattern is most significant when the cup is U-shaped (not V-shaped), when the handle forms in the upper half of the cup, and when the breakout occurs on expanding volume.
How to Identify the Cup and Handle Pattern
To qualify as a valid Cup and Handle, the pattern must meet the following criteria:
- Prior uptrend: The pattern must form after a clear uptrend — the Cup and Handle is a continuation pattern.
- Cup: A rounded, U-shaped price decline of 15–35% from the prior high, followed by a recovery back to the prior high level (the "rim"). The cup should be rounded, not V-shaped. V-shaped cups are less reliable.
- Cup depth: The cup should decline 15–35% from the rim. Deeper cups (more than 35%) are less reliable.
- Cup duration: The cup should take at least 7 weeks to form on the weekly chart (or 5–10 weeks is ideal). Cups that form too quickly are less reliable.
- Handle: A small pullback of 5–15% from the cup's rim, forming in the upper half of the cup. The handle should not retrace more than 50% of the cup's depth.
- Handle duration: The handle should last 1–4 weeks on the weekly chart.
- Volume: Volume should decline during the cup's right side and the handle, then expand significantly on the breakout above the rim.
Pattern Statistics
Based on quantitative research by Thomas Bulkowski (Encyclopedia of Chart Patterns, 3rd edition) and William O'Neil's original research, and independent backtests on cryptocurrency markets (BTC/USDT, ETH/USDT, SOL/USDT, 2018–2026):
| Metric | Value |
|---|---|
| Confirmed breakout success rate | ~65–72% |
| Average gain after confirmed breakout | ~25–40% |
| Best performing timeframe | Weekly (1W) and Daily (1D) |
| Failure rate after breakout | ~28–35% |
| Ideal cup depth | 15–35% |
| Ideal handle retracement | 5–15% |
What Does It Signal?
The Cup and Handle represents a period of healthy consolidation in an uptrend. The cup forms as early buyers take profits (left side) and new buyers accumulate (right side). The handle is a final shakeout of weak holders before the breakout. When price breaks above the rim on high volume, it signals that the consolidation is complete and the uptrend is resuming.
The rounded shape of the cup is important: it shows a gradual, orderly transition from selling to buying, rather than a sharp V-shaped reversal. This gradual transition is a sign of healthy accumulation.
Cup and Handle vs Similar Patterns
| Pattern | Shape | Type | Signal |
|---|---|---|---|
| Cup and Handle | U-shape + small pullback | Continuation | Bullish |
| Rounding Bottom | U-shape (no handle) | Reversal | Bullish |
| Double Bottom | W-shape | Reversal | Bullish |
| Ascending Triangle | Flat top + rising bottom | Continuation | Bullish |
| Bull Flag | Flagpole + downward channel | Continuation | Bullish |
Confirmation Rules
A Cup and Handle is considered confirmed when:
- Price breaks above the cup's rim (prior high) on expanding volume. This is the primary confirmation signal.
- The handle forms in the upper half of the cup. A handle that forms in the lower half of the cup is a weaker signal.
- The handle retraces no more than 50% of the cup's depth. A deeper handle retracement weakens the pattern.
- Volume declines during the handle and expands on the breakout. This volume profile confirms accumulation during the handle.
Common Mistakes
- Accepting a V-shaped cup: A V-shaped cup (sharp decline and recovery) is less reliable than a rounded U-shaped cup. The rounding indicates gradual accumulation, not a sharp reversal.
- Accepting a handle that forms in the lower half of the cup: The handle should form in the upper half of the cup (within 15% of the rim). A handle that forms near the bottom of the cup is a warning sign.
- Ignoring the prior uptrend: The Cup and Handle is a continuation pattern. A cup that forms without a prior uptrend is less reliable.
- Entering during the handle: The entry is on the breakout above the rim, not during the handle consolidation.
- Accepting too deep a cup: A cup that declines more than 35–40% from the rim is too deep and less reliable.
- Ignoring volume on the breakout: A breakout on low volume is a warning sign of a false breakout.
When the Pattern Fails
Handle breaks below the cup's midpoint: If the handle retracement exceeds 50% of the cup's depth, the pattern is weakening. A handle that breaks below the cup's midpoint invalidates the pattern.
False rim breakout: Price breaks above the rim but quickly reverses back into the handle. This typically occurs on low volume and is a warning sign that the breakout is not genuine.
Cup is too deep or too V-shaped: Cups that decline more than 35–40% or that are V-shaped rather than U-shaped have higher failure rates. These patterns often resolve as consolidations rather than continuation patterns.
Backtest Details
The statistics on this page are based on a systematic backtest of historical OHLCV data. Below are the full methodology parameters for this pattern.
These statistics represent historical averages on cryptocurrency markets. Results vary by market regime, asset, and confirmation criteria. Past performance does not guarantee future results.
Frequently Asked Questions
What is the Cup and Handle pattern?
The Cup and Handle is a bullish continuation pattern. The cup is a rounded U-shaped bottom (typically 7 weeks to 65 weeks on weekly charts). The handle is a brief downward consolidation (typically 1–4 weeks) after the cup forms. A breakout above the cup rim confirms the pattern.
How do you trade the Cup and Handle?
Enter long on a confirmed breakout above the cup rim with increased volume. Place stop-loss below the handle's low. The measured move target equals the depth of the cup added to the breakout point.
What makes a valid Cup and Handle?
Key criteria: (1) the cup has a smooth, rounded bottom (not V-shaped); (2) the handle retraces 30–50% of the cup's right side; (3) volume decreases during the handle and increases on the breakout; (4) the handle forms in the upper half of the cup.
How long does a Cup and Handle take to form?
On weekly charts, the cup typically takes 7–65 weeks to form. On daily charts, it can form in 7–65 days. Longer cups are generally more reliable than shorter ones.
Limitations
This pattern is not a standalone trading signal. Its historical performance depends on market regime, liquidity, volatility, timeframe, and confirmation method. The backtest statistics on this page use historical cryptocurrency data from Binance (BTC/USDT, ETH/USDT, SOL/USDT) and do not predict future performance. Technical analysis is inherently subjective — pattern recognition varies between analysts. Always apply your own judgment, use proper risk management, and consult a qualified financial advisor before making trading decisions. See our full Methodology and Disclaimer.
Common False Positives
Cup and Handle is a complex pattern with strict structural requirements. These formations are commonly mistaken for it:
Cup and Handle — Full Backtest Results
We tested 156 occurrences of the Cup and Handle on BTC/USDT, ETH/USDT, SOL/USDT, and BNB/USDT using Binance historical OHLCV data from 2018 to 2026.