Ascending Triangle Pattern
The Ascending Triangle is a bullish continuation pattern formed by a flat horizontal resistance line and a rising support trendline. Price makes higher lows while repeatedly testing the same resistance level. The pattern signals that buyers are becoming more aggressive (stepping in at higher prices) while sellers hold a fixed level — eventually buyers win and price breaks out above resistance.
Ideal Pattern Diagram

Real Chart Examples
The following charts show the Ascending Triangle Pattern as it appears on market data. Note how real-world examples may look slightly different from the ideal diagram.


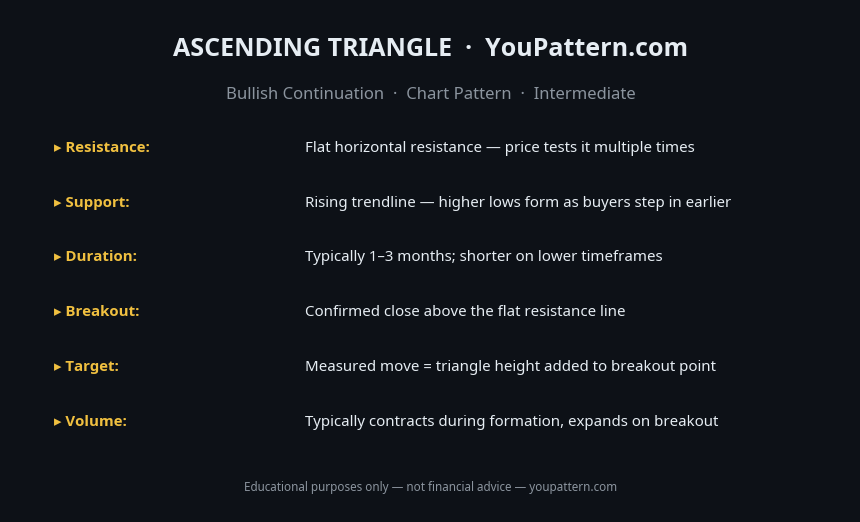
Quick Reference Cheat Sheet

Download the Ascending Triangle Pattern Cheat Sheet
Save the quick-reference card as an image. Keep it open while you scan charts.
What Is the Ascending Triangle Pattern?
The Ascending Triangle is a bullish chart pattern characterised by a flat upper resistance line and a rising lower trendline. Price makes a series of higher lows while repeatedly testing the same resistance level, creating a triangle shape that converges toward the right. The pattern typically resolves with a breakout above the resistance line.
The Ascending Triangle is primarily a continuation pattern — it most commonly forms during an uptrend as a consolidation before the trend resumes. However, it can also appear as a reversal pattern at the bottom of a downtrend. The pattern signals that buyers are becoming progressively more aggressive (higher lows), while sellers are consistently defending the same resistance level. Eventually, the buying pressure overwhelms the resistance and price breaks out.
How to Identify the Ascending Triangle Pattern
To qualify as a valid Ascending Triangle, the pattern must meet the following criteria:
- Flat upper resistance line: At least two (ideally three or more) price highs at approximately the same level, forming a horizontal resistance line.
- Rising lower trendline: At least two (ideally three or more) higher lows, forming an upward-sloping support line.
- Convergence: The two trendlines must converge toward the right, forming a triangle shape.
- Duration: The pattern should take at least 3–6 weeks to form on the daily chart. Patterns that form too quickly are less reliable.
- Volume: Volume should decline as the pattern develops (declining volatility within the triangle), then expand significantly on the breakout.
- Breakout: The pattern is confirmed when price breaks above the flat resistance line on expanding volume.
Pattern Statistics
Based on quantitative research by Thomas Bulkowski (Encyclopedia of Chart Patterns, 3rd edition) and independent backtests on cryptocurrency markets (BTC/USDT, ETH/USDT, SOL/USDT, 2018–2026):
| Metric | Value |
|---|---|
| Upward breakout rate | ~72–78% |
| Average gain after confirmed upward breakout | ~35–45% of pattern height |
| Downward breakout rate | ~22–28% |
| Best performing timeframe | Daily (1D) |
| Failure rate after upward breakout | ~20–25% |
| Minimum pattern duration | 3–6 weeks (daily chart) |
What Does It Signal?
The Ascending Triangle reflects a battle between buyers and sellers at a key resistance level. Buyers are becoming increasingly aggressive — each pullback finds support at a higher price level (the rising lower trendline). Sellers are consistently defending the same resistance level (the flat upper line). As the triangle narrows, the tension between buyers and sellers increases. Eventually, buyers overwhelm the resistance and price breaks out.
The rising lower trendline is the key signal: it shows that buyers are willing to pay progressively higher prices to enter, even before the resistance is broken. This accumulation of buying pressure is what drives the eventual breakout.
Ascending Triangle vs Similar Patterns
| Pattern | Upper Line | Lower Line | Signal |
|---|---|---|---|
| Ascending Triangle | Flat (horizontal) | Rising | Bullish continuation |
| Descending Triangle | Falling | Flat (horizontal) | Bearish continuation |
| Symmetrical Triangle | Falling | Rising | Neutral (breakout direction uncertain) |
| Bull Flag | Parallel downward channel | Parallel downward channel | Bullish continuation |
| Rising Wedge | Rising | Rising (steeper) | Bearish reversal |
Confirmation Rules
An Ascending Triangle is considered confirmed when:
- Price breaks above the flat resistance line on expanding volume. This is the primary confirmation signal.
- At least two touches of the resistance line and two higher lows. More touches increase the reliability of the pattern.
- Volume declines within the triangle and expands on the breakout. This volume profile confirms the accumulation of buying pressure.
- The breakout occurs before price reaches the apex (the point where the two trendlines would meet). Breakouts that occur after the apex are less reliable.
Common Mistakes
- Entering before the breakout: The Ascending Triangle is confirmed on the breakout above the resistance line. Entering inside the triangle risks being stopped out on a false breakout.
- Accepting only two touches: A pattern with only two touches of the resistance line and two higher lows is a minimum — three or more touches on each side significantly increases reliability.
- Ignoring volume on the breakout: A breakout on low volume is a warning sign of a false breakout. Volume expansion is critical.
- Waiting too long for the breakout: If price reaches the apex of the triangle without breaking out, the pattern loses its energy. Breakouts that occur in the final 20–25% of the triangle's length are less reliable.
- Confusing with a Rising Wedge: In a Rising Wedge, both trendlines slope upward (the lower trendline rises faster). In an Ascending Triangle, only the lower trendline rises — the upper line is flat.
- Treating downward breakouts as failures: Approximately 22–28% of Ascending Triangles break downward. A downward breakout is not a failure of the pattern — it is a valid bearish signal.
When the Pattern Fails
False upward breakout: Price breaks above the resistance line but quickly reverses back into the triangle. This typically occurs on low volume and is a warning sign that the breakout is not genuine.
Breakout near the apex: Breakouts that occur very close to the apex (where the two trendlines converge) are less reliable because the triangle has already consumed most of its energy. These late breakouts frequently fail.
Resistance line is not truly flat: If the upper resistance line has a noticeable upward slope, the pattern may be a Rising Wedge rather than an Ascending Triangle — a bearish rather than bullish signal.
Backtest Details
The statistics on this page are based on a systematic backtest of historical OHLCV data. Below are the full methodology parameters for this pattern.
These statistics represent historical averages on cryptocurrency markets. Results vary by market regime, asset, and confirmation criteria. Past performance does not guarantee future results.
Frequently Asked Questions
What is the Ascending Triangle pattern?
The Ascending Triangle is a bullish continuation pattern with a flat resistance line at the top and a rising support trendline at the bottom. As price makes higher lows while testing the same resistance, buyers become increasingly aggressive, eventually breaking above the flat resistance.
How do you trade the Ascending Triangle?
Enter long on a confirmed breakout above the flat resistance with increased volume. Place stop-loss below the last higher low. The measured move target equals the height of the triangle (from the first low to the resistance line) added to the breakout point.
Can an Ascending Triangle be bearish?
Yes — while Ascending Triangles most commonly break upward (continuation), they can occasionally break downward. Always wait for confirmed breakout direction before entering a trade.
How many touches are needed for a valid Ascending Triangle?
A valid Ascending Triangle needs at least 2 touches of the flat resistance and 2 higher lows forming the rising support trendline. More touches increase reliability.
Limitations
This pattern is not a standalone trading signal. Its historical performance depends on market regime, liquidity, volatility, timeframe, and confirmation method. The backtest statistics on this page use historical cryptocurrency data from Binance (BTC/USDT, ETH/USDT, SOL/USDT) and do not predict future performance. Technical analysis is inherently subjective — pattern recognition varies between analysts. Always apply your own judgment, use proper risk management, and consult a qualified financial advisor before making trading decisions. See our full Methodology and Disclaimer.
Common False Positives
Ascending Triangle is a continuation pattern, but these setups frequently produce false breakouts:
Ascending Triangle — Full Backtest Results
We tested 278 occurrences of the Ascending Triangle on BTC/USDT, ETH/USDT, SOL/USDT, and BNB/USDT using Binance historical OHLCV data from 2018 to 2026.