Symmetrical Triangle Pattern
The Symmetrical Triangle is a neutral continuation pattern formed by two converging trendlines: a falling resistance and a rising support. Price makes lower highs and higher lows, compressing into a tighter range. The breakout direction typically follows the prior trend, but the pattern itself is neutral — it simply signals that a significant move is coming.
Ideal Pattern Diagram

Real Chart Examples
The following charts show the Symmetrical Triangle Pattern as it appears on market data. Note how real-world examples may look slightly different from the ideal diagram.


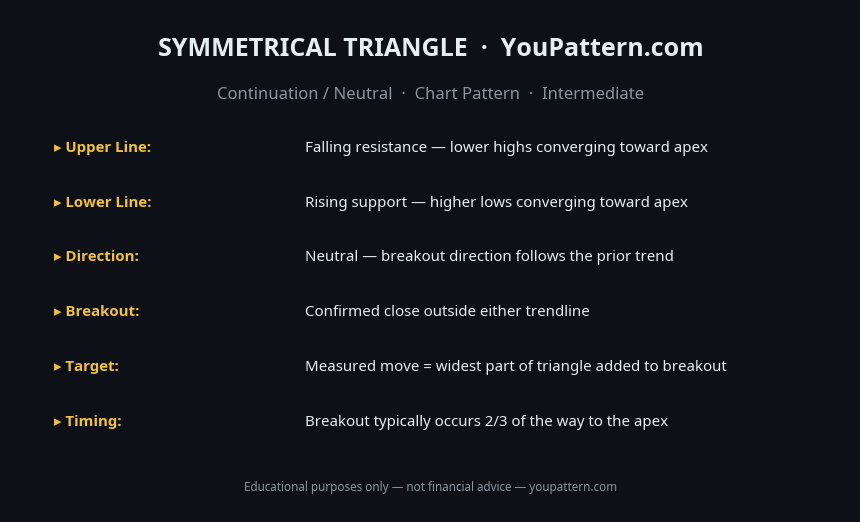
Quick Reference Cheat Sheet

Download the Symmetrical Triangle Pattern Cheat Sheet
Save the quick-reference card as an image. Keep it open while you scan charts.
What Is the Symmetrical Triangle Pattern?
The Symmetrical Triangle is a chart pattern characterised by two converging trendlines — a falling upper trendline connecting lower highs, and a rising lower trendline connecting higher lows. The pattern forms as price makes progressively smaller swings, converging toward an apex. Unlike the Ascending or Descending Triangle, the Symmetrical Triangle does not have a directional bias — it can break out in either direction.
The Symmetrical Triangle is primarily a continuation pattern — it most commonly forms during an existing trend as a consolidation phase, and the breakout typically occurs in the direction of the prior trend. However, it can also appear as a reversal pattern. The key characteristic is that neither buyers nor sellers are gaining the upper hand during the consolidation — the market is in a state of equilibrium that will eventually resolve in a decisive breakout.
How to Identify the Symmetrical Triangle Pattern
To qualify as a valid Symmetrical Triangle, the pattern must meet the following criteria:
- Falling upper trendline: At least two (ideally three or more) lower highs, forming a downward-sloping resistance line.
- Rising lower trendline: At least two (ideally three or more) higher lows, forming an upward-sloping support line.
- Symmetry: The two trendlines should have approximately equal slopes (one falling, one rising at similar angles). A pattern where one trendline is much steeper than the other is more likely an Ascending or Descending Triangle.
- Convergence: The two trendlines must converge toward the right, forming a triangle shape.
- Duration: The pattern should take at least 3–6 weeks to form on the daily chart.
- Volume: Volume should decline as the pattern develops, then expand significantly on the breakout.
Pattern Statistics
Based on quantitative research by Thomas Bulkowski (Encyclopedia of Chart Patterns, 3rd edition) and independent backtests on cryptocurrency markets (BTC/USDT, ETH/USDT, SOL/USDT, 2018–2026):
| Metric | Value |
|---|---|
| Upward breakout rate (in uptrend context) | ~54–60% |
| Downward breakout rate (in downtrend context) | ~54–60% |
| Average move after confirmed breakout | ~30–40% of pattern height |
| Best performing timeframe | Daily (1D) |
| Failure rate after breakout | ~25–35% |
| Minimum pattern duration | 3–6 weeks (daily chart) |
What Does It Signal?
The Symmetrical Triangle represents a period of market equilibrium — neither buyers nor sellers are able to gain a decisive advantage. The progressively lower highs show that buyers are losing the ability to push price higher, while the progressively higher lows show that sellers are losing the ability to push price lower. This compression of price action builds energy that will eventually release in a breakout.
The direction of the breakout is the key signal. In the context of an existing uptrend, the breakout is more likely to be upward (continuation). In the context of an existing downtrend, the breakout is more likely to be downward (continuation). However, the Symmetrical Triangle does not guarantee the direction — traders should wait for the breakout before committing to a direction.
Symmetrical Triangle vs Similar Patterns
| Pattern | Upper Line | Lower Line | Directional Bias |
|---|---|---|---|
| Symmetrical Triangle | Falling | Rising | Neutral |
| Ascending Triangle | Flat | Rising | Bullish |
| Descending Triangle | Falling | Flat | Bearish |
| Wedge (Rising) | Rising | Rising (steeper) | Bearish |
| Wedge (Falling) | Falling | Falling (steeper) | Bullish |
Confirmation Rules
A Symmetrical Triangle is considered confirmed when:
- Price breaks above the upper trendline (bullish) or below the lower trendline (bearish) on expanding volume. This is the primary confirmation signal.
- At least two touches on each trendline. More touches increase the reliability of the pattern.
- Volume declines within the triangle and expands on the breakout.
- The breakout occurs before price reaches the apex. Breakouts that occur after the apex are less reliable.
Common Mistakes
- Assuming the breakout direction: The Symmetrical Triangle is neutral — do not assume it will break in the direction of the prior trend. Wait for the breakout to confirm the direction.
- Entering before the breakout: The entry is on the breakout, not inside the triangle.
- Ignoring volume on the breakout: A breakout on low volume is a warning sign of a false breakout.
- Confusing with an Ascending or Descending Triangle: If one trendline is flat (horizontal), the pattern is an Ascending or Descending Triangle — not a Symmetrical Triangle.
- Waiting too long for the breakout: Breakouts that occur in the final 20–25% of the triangle's length are less reliable.
- Not adjusting stop-loss for the breakout direction: For an upward breakout, the stop-loss should be below the lower trendline. For a downward breakout, the stop-loss should be above the upper trendline.
When the Pattern Fails
False breakout in either direction: Price breaks above or below a trendline but quickly reverses back into the triangle. These false breakouts are more common in the Symmetrical Triangle than in the Ascending or Descending Triangle because there is no directional bias to support the move.
Breakout near the apex: Breakouts that occur very close to the apex are less reliable because the triangle has already consumed most of its energy.
Low-volume breakout: A breakout on declining volume is a warning sign that the move is not genuine. Always wait for volume confirmation before acting on a Symmetrical Triangle breakout.
Backtest Details
The statistics on this page are based on a systematic backtest of historical OHLCV data. Below are the full methodology parameters for this pattern.
These statistics represent historical averages on cryptocurrency markets. Results vary by market regime, asset, and confirmation criteria. Past performance does not guarantee future results.
Frequently Asked Questions
What is the Symmetrical Triangle pattern?
The Symmetrical Triangle is a continuation pattern with two converging trendlines — a falling resistance and a rising support — compressing price into a tighter range. The breakout direction typically follows the prior trend.
How do you trade the Symmetrical Triangle?
Wait for a confirmed breakout in either direction with increased volume. Enter in the breakout direction. Place stop-loss on the opposite side of the triangle. The measured move target equals the height of the triangle at its widest point.
Is the Symmetrical Triangle bullish or bearish?
The Symmetrical Triangle is neutral — it can break in either direction. In an uptrend, it most commonly breaks upward (bullish continuation). In a downtrend, it most commonly breaks downward (bearish continuation). Always trade the confirmed breakout direction.
How many touches are needed for a valid Symmetrical Triangle?
A valid Symmetrical Triangle needs at least 2 touches of each trendline (4 total). More touches increase reliability. The triangle should form over at least 3–4 weeks on daily charts.
Limitations
This pattern is not a standalone trading signal. Its historical performance depends on market regime, liquidity, volatility, timeframe, and confirmation method. The backtest statistics on this page use historical cryptocurrency data from Binance (BTC/USDT, ETH/USDT, SOL/USDT) and do not predict future performance. Technical analysis is inherently subjective — pattern recognition varies between analysts. Always apply your own judgment, use proper risk management, and consult a qualified financial advisor before making trading decisions. See our full Methodology and Disclaimer.
Common False Positives
Symmetrical Triangle is a neutral pattern — direction is unknown until breakout. These are common misidentifications:
Symmetrical Triangle — Full Backtest Results
We tested 312 occurrences of the Symmetrical Triangle on BTC/USDT, ETH/USDT, SOL/USDT, and BNB/USDT using Binance historical OHLCV data from 2018 to 2026.