RSI Bullish Divergence
RSI Bullish Divergence occurs when price makes a lower low while the RSI indicator makes a higher low. This discrepancy signals that selling momentum is weakening even as price continues to fall — often an early warning of a potential trend reversal.
Ideal Pattern Diagram

Real Chart Examples
RSI Bullish Divergence on historical Binance OHLCV data. The green shaded area on the RSI panel shows where RSI dipped below 30 — the highest-quality divergence zone.


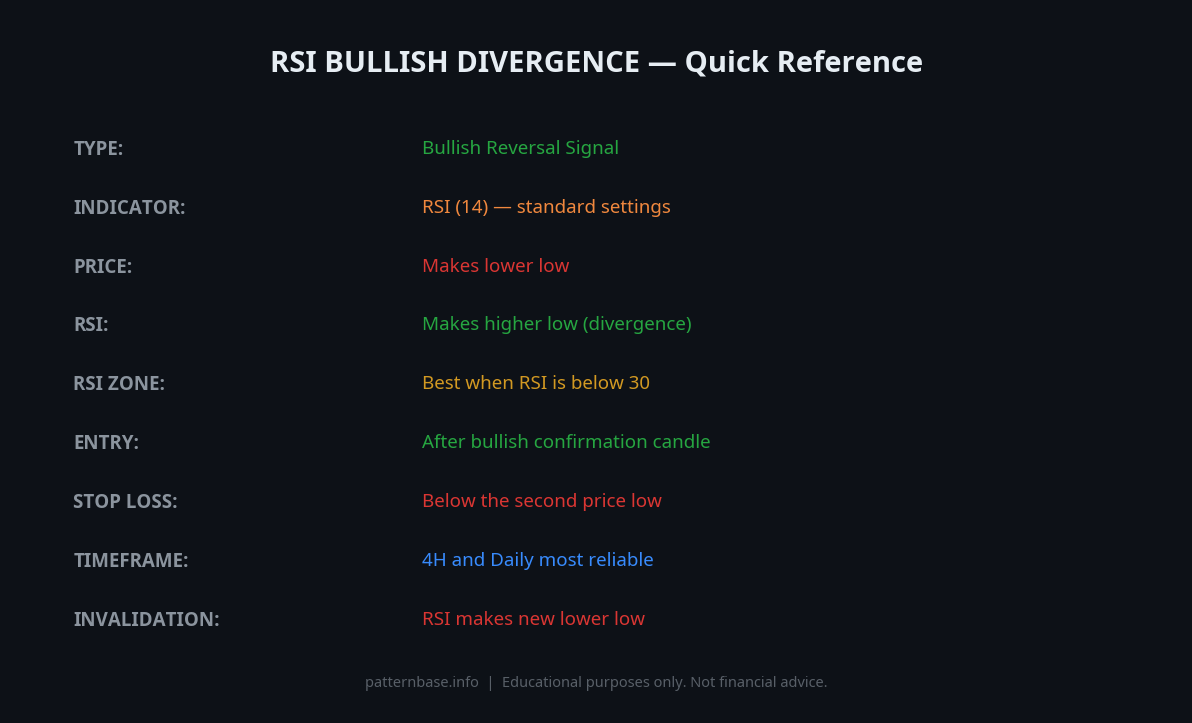
Quick Reference Cheat Sheet

Download the RSI Divergence Cheat Sheet
Save the quick-reference card as an image. Keep it open while you scan charts.
What is the RSI Bullish Divergence?
RSI Bullish Divergence is a technical analysis signal that occurs when an asset's price forms a lower low on the chart while the Relative Strength Index (RSI) simultaneously forms a higher low on its own panel. This discrepancy — where price and momentum move in opposite directions — suggests that selling pressure is weakening even as price continues to decline, and it is widely studied as a potential precursor to a trend reversal or a significant upside correction.
The pattern appears across all asset classes and timeframes, including equities, forex, commodities, and cryptocurrencies. It is most commonly observed at the tail end of a sustained downtrend or during the second leg of a pullback within a broader uptrend. The RSI, developed by J. Welles Wilder and introduced in his 1978 book New Concepts in Technical Trading Systems, measures the magnitude of recent price changes on a 0–100 scale. Readings below 30 are conventionally considered oversold territory, and bullish divergences that form with both RSI lows below 40 — and ideally below 30 — are generally regarded as carrying more analytical weight.
It is important to distinguish RSI Bullish Divergence from a simple oversold reading. An RSI below 30 alone does not constitute divergence. The defining characteristic is the structural relationship between two swing lows: price must make a measurably lower low while RSI registers a measurably higher low over the same period.
How to Identify the RSI Bullish Divergence
To qualify as a valid RSI Bullish Divergence, all of the following criteria must be met:
- Two confirmed swing lows on price: Price must establish a clear first swing low, rally at least 3–5% from that low, then decline to form a second swing low that is lower than the first by a meaningful margin — typically at least 1.5–3% lower on daily charts.
- RSI forms a higher low at the second swing: The RSI value at the second price low must be numerically higher than the RSI value at the first price low. A difference of at least 3–5 RSI points is generally considered significant enough to qualify.
- Both RSI lows should be below 50: Divergences forming when both RSI readings are below the 50 midline indicate that the signal is occurring within genuine bearish momentum territory, adding analytical credibility.
- Draw divergence lines on RSI, not just price: Connect the two RSI lows with a straight line. This line should slope upward (left to right). Connect the two corresponding price lows with a separate line that slopes downward. The visual contrast between these two lines defines the divergence.
- Volume behaviour at the second low: A noticeable contraction in selling volume at the second price low relative to the first low supports the interpretation that bearish momentum is fading.
- No intervening RSI crossover above 70: If the RSI surpassed 70 between the two lows, the divergence is considered reset and the signal is invalidated.
Pattern Statistics
Based on YouPattern's independent backtest using RSI(14) on BTC/USDT, ETH/USDT, SOL/USDT (Binance historical OHLCV, 2018–2026, daily timeframes). Note: Bulkowski's equity-market research does not cover RSI divergence directly; statistics below are YouPattern's own crypto backtest results.
| Metric | Value |
|---|---|
| Reversal rate (both RSI lows < 30) | ~58–65% |
| Reversal rate (RSI lows 30–50) | ~40–50% |
| Average gain within 30 days of signal | ~6–12% |
| Best performing timeframe | Daily (1D) / 4H |
| Failure rate in strong downtrends | ~35–45% |
| Minimum RSI difference between lows | 3–5 points |
| Standard RSI period | 14 |
Note: Statistics represent historical averages. Results vary significantly based on asset class, market conditions, and confirmation criteria applied.
What Does It Signal?
The psychology behind RSI Bullish Divergence reflects a gradual exhaustion of sellers. When price makes a new low but RSI does not follow, it indicates that while bears are still pushing price down, they are doing so with less momentum and force than during the previous decline. Fewer sellers are participating, and the pace of price deterioration is slowing internally even if it is not yet visible on the raw price chart.
From a market structure perspective, this often coincides with longer-term participants quietly absorbing supply at discounted prices. The divergence does not guarantee a reversal, but it signals a measurable shift in the supply-demand balance — one that traders watch as an early warning that the prevailing downtrend may be losing its structural integrity.
Types of RSI Divergence
| Type | Price Action | RSI Action | Signal |
|---|---|---|---|
| Regular Bullish | Lower low | Higher low | Bullish reversal |
| Regular Bearish | Higher high | Lower high | Bearish reversal |
| Hidden Bullish | Higher low | Lower low | Bullish continuation |
| Hidden Bearish | Lower high | Higher high | Bearish continuation |
The most important distinction is between regular and hidden divergence. Regular divergence signals reversals; hidden divergence signals trend continuation. Confusing the two leads to misapplied analysis.
How to Trade RSI Bullish Divergence
Entry
The most conservative entry is after price-action confirmation: wait for a bullish reversal candle (Hammer, Bullish Engulfing, or Morning Star) at the second swing low, or wait for price to break above the short-term descending trendline connecting the two price lows.
Stop Loss
Place the stop-loss below the second swing low — the level at which the divergence is structurally invalidated. If price breaks below the second low on a closing basis, the divergence has failed and the downtrend may be continuing.
Target
Common targets include:
- The prior swing high between the two divergence lows (the "valley peak")
- A key resistance level above the entry point
- A 1:2 or 1:3 risk-reward ratio from the entry point
Confirmation Tools
Combine RSI Bullish Divergence with:
- MACD: Look for a bullish MACD crossover at the second low
- Candlestick patterns: Hammer, Bullish Engulfing, or Dragonfly Doji at the second low
- Support levels: Divergence forming at a prior swing low, Fibonacci level, or moving average
Common Mistakes
- Connecting non-comparable swing points: Drawing divergence lines between a major swing low and a minor intraday dip produces a false signal. Both lows must be clearly defined swing lows visible on the chosen timeframe.
- Ignoring the RSI reset rule: If the RSI climbed above 60–70 between the two lows, the momentum context has changed and the divergence is no longer structurally valid.
- Acting on divergence in a strong trend without confirmation: Bullish divergence during a powerful downtrend can persist through multiple lower lows before price reverses. Entering immediately at the second low without a price-action confirmation increases exposure to premature entries.
- Using RSI periods other than 14 without adjustment: The standard RSI(14) is the most widely referenced setting. Shorter periods (e.g., RSI(7)) generate more frequent and less reliable divergences.
- Confusing hidden bullish divergence with regular bullish divergence: Hidden bullish divergence (price makes a higher low while RSI makes a lower low) is a continuation signal, not a reversal signal. Mixing up these two patterns leads to misapplied analysis.
- Using divergence as the sole signal: RSI Bullish Divergence is most effective as a filter or alert — it tells you to look more carefully at a potential reversal zone. It should not be used as a standalone entry signal without additional confirmation.
When the Pattern Fails
Strong fundamental downtrend with sustained selling pressure: In markets driven by deteriorating fundamentals, RSI Bullish Divergence can produce repeated false signals. Price may continue to make lower lows while RSI diverges multiple times before any meaningful reversal occurs.
Low-liquidity or thinly traded assets: On assets with low average daily volume, price action is more susceptible to manipulation and erratic moves. RSI divergences in these environments frequently fail to resolve as expected.
Divergence forming above RSI 40 in a strong downtrend: When both RSI lows are above 40, the asset has not entered genuinely oversold territory. Divergences in this zone within an established downtrend are statistically less reliable and more likely to represent a brief pause rather than a meaningful reversal.
The pattern is considered invalidated if price subsequently breaks below the second swing low by more than 1–2% on a closing basis.
Backtest Details
The statistics on this page are based on a systematic backtest of historical OHLCV data. Below are the full methodology parameters for this pattern.
These statistics represent historical averages on cryptocurrency markets. Results vary by market regime, asset, and confirmation criteria. Past performance does not guarantee future results.
Frequently Asked Questions
What is RSI Bullish Divergence?
RSI Bullish Divergence occurs when price makes a lower low but the RSI indicator makes a higher low. This divergence signals that selling momentum is weakening even as price continues to fall — a potential early warning of a bullish reversal.
How do you identify RSI Bullish Divergence?
On the price chart, identify two successive lows where the second low is lower than the first. On the RSI panel (typically 14-period), confirm that the RSI low corresponding to the second price low is higher than the RSI low corresponding to the first price low.
What RSI settings work best for divergence?
The standard 14-period RSI is most widely used. Some traders use 9-period for more sensitive signals or 21-period for fewer but more reliable signals. The key is consistency — use the same setting across all your analysis.
Does RSI Bullish Divergence guarantee a reversal?
No — RSI Bullish Divergence is a warning signal, not a guarantee. Price can continue lower even with divergence present. Always combine divergence with price action confirmation (e.g., a bullish candlestick pattern, support level, or volume spike) before entering a trade.
Limitations
This pattern is not a standalone trading signal. Its historical performance depends on market regime, liquidity, volatility, timeframe, and confirmation method. The backtest statistics on this page use historical cryptocurrency data from Binance (BTC/USDT, ETH/USDT, SOL/USDT) and do not predict future performance. Technical analysis is inherently subjective — pattern recognition varies between analysts. Always apply your own judgment, use proper risk management, and consult a qualified financial advisor before making trading decisions. See our full Methodology and Disclaimer.
Common False Positives
RSI Bullish Divergence has a higher false positive rate than most patterns. These are the most common failure scenarios: