RSI Bearish Divergence
RSI Bearish Divergence occurs when price makes a higher high while the RSI indicator makes a lower high. This divergence between price action and momentum signals that the uptrend is losing strength — buyers are pushing price higher but with less force each time. It is most reliable when the RSI is in the overbought zone (above 60–70).
Ideal Pattern Diagram

Real Chart Examples
The following charts show the RSI Bearish Divergence as it appears on market data. Note how real-world examples may look slightly different from the ideal diagram.


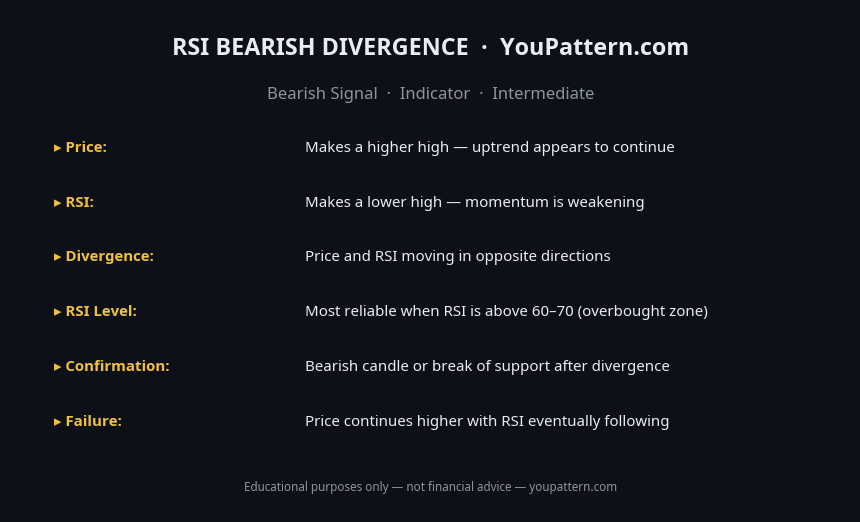
Quick Reference Cheat Sheet

Download the RSI Bearish Divergence Cheat Sheet
Save the quick-reference card as an image. Keep it open while you scan charts.
What Is RSI Bearish Divergence?
RSI Bearish Divergence occurs when price makes a higher high, but the RSI (Relative Strength Index) makes a lower high at the same time. This divergence between price and momentum signals that the uptrend is losing strength — buyers are pushing price higher, but with less and less momentum. It is one of the most reliable early warning signals of a potential trend reversal or significant pullback.
The RSI, developed by J. Welles Wilder in 1978, measures the speed and magnitude of price changes on a scale of 0 to 100. When price makes a new high but RSI fails to confirm it with a new high, it indicates that the buying pressure behind the price move is weakening — a classic bearish divergence signal.
There are two types of RSI bearish divergence:
- Regular Bearish Divergence: Price makes a higher high, RSI makes a lower high. Signals a potential trend reversal.
- Hidden Bearish Divergence: Price makes a lower high, RSI makes a higher high. Signals a continuation of the existing downtrend.
How to Identify RSI Bearish Divergence
To identify a valid RSI Bearish Divergence:
- Two price highs: Identify two swing highs on the price chart, where the second high is higher than the first.
- Two RSI highs: At the same two swing highs, the RSI reading at the second high must be lower than the RSI reading at the first high.
- The divergence must be clear: The difference between the two RSI readings should be meaningful (at least 3–5 RSI points). A very small divergence is not reliable.
- RSI level: The strongest bearish divergence signals occur when the RSI is in overbought territory (above 70) at the first high, and fails to reach overbought territory at the second high.
- Trend context: Regular bearish divergence is most reliable when it appears during an uptrend. Hidden bearish divergence is most reliable during a downtrend.
RSI Divergence Types:
| Type | Price | RSI | Signal |
|---|---|---|---|
| Regular Bearish | Higher high | Lower high | Potential reversal (bearish) |
| Hidden Bearish | Lower high | Higher high | Trend continuation (bearish) |
| Regular Bullish | Lower low | Higher low | Potential reversal (bullish) |
| Hidden Bullish | Higher low | Lower low | Trend continuation (bullish) |
Pattern Statistics
Based on independent backtests on cryptocurrency markets (BTC/USDT, ETH/USDT, SOL/USDT, 2018–2026), daily timeframe:
| Metric | Value |
|---|---|
| Win rate (regular bearish divergence, daily) | ~60–67% |
| Average decline after confirmed signal (30 days) | ~8–15% |
| Best performing RSI period | 14 (default) |
| Best performing timeframe | Daily (1D) and 4H |
| False signal rate | ~33–40% |
| Strongest signal context | RSI overbought (>70) at first high |
What Does It Signal?
RSI Bearish Divergence signals that the momentum behind an uptrend is weakening. When price makes a new high but RSI fails to confirm it, it means that the rate of price increase is slowing — buyers are still pushing price higher, but with diminishing force. This is analogous to a car accelerating but with the engine losing power — it may continue forward for a while, but it will eventually slow down and stop.
The divergence is a warning signal, not an immediate reversal trigger. Price can continue higher for several candles after the divergence forms before the reversal occurs. This is why confirmation from price action (a bearish candlestick pattern, a break below support, or a MACD bearish crossover) is important before acting on the divergence.
RSI Bearish Divergence vs Similar Signals
| Signal | Indicator | Timing | Reliability |
|---|---|---|---|
| RSI Bearish Divergence | RSI + Price | Leading | Moderate-High |
| MACD Bearish Divergence | MACD + Price | Leading | Moderate-High |
| MACD Bearish Crossover | MACD | Lagging | Moderate |
| Death Cross | 50/200 SMA | Lagging | High (slower) |
| Bearish Engulfing | Price action | Coincident | Moderate |
Confirmation Rules
RSI Bearish Divergence is considered a high-quality signal when:
- The RSI is in overbought territory (above 70) at the first high. This indicates that the initial move was genuinely overextended, making the failure to reach overbought territory at the second high more significant.
- The divergence spans at least 2–3 weeks on the daily chart. Very short-term divergences (spanning only a few days) are less reliable.
- Price action confirms the signal — a bearish candlestick pattern (Shooting Star, Bearish Engulfing, Evening Star) or a break below a support level occurring after the divergence.
- The divergence is visible on multiple timeframes. A bearish divergence on both the daily and 4-hour charts is a stronger signal than one on a single timeframe.
- Volume is declining on the second price high, confirming that the buying pressure is weakening.
Common Mistakes
- Acting on the divergence immediately: RSI Bearish Divergence is a warning signal, not an immediate entry trigger. Price can continue higher for several candles after the divergence forms. Always wait for price action confirmation before entering.
- Using too short a lookback period: Divergences that span only 2–3 candles are unreliable. The divergence should span at least 2–3 weeks on the daily chart to be meaningful.
- Ignoring the RSI level: A bearish divergence where the RSI never reached overbought territory (above 70) at either high is a weaker signal than one where the RSI was overbought at the first high.
- Confusing regular and hidden divergence: Regular bearish divergence (price higher high, RSI lower high) signals a potential reversal. Hidden bearish divergence (price lower high, RSI higher high) signals a continuation of the downtrend. These are different signals with different implications.
- Using RSI divergence in strongly trending markets: In a strong, momentum-driven uptrend, RSI can remain overbought for extended periods. Bearish divergences in these conditions frequently fail as price continues higher.
- Not combining with other signals: RSI Bearish Divergence is most reliable when combined with other bearish signals — resistance levels, bearish candlestick patterns, or MACD bearish crossovers.
When the Signal Fails
Price continues higher despite divergence: In strong bull markets, RSI Bearish Divergence can persist for weeks or months while price continues to make new highs. The divergence eventually resolves, but the timing is unpredictable. This is the most common failure mode.
Divergence resolves through RSI recovery: Instead of price declining, the RSI recovers and makes a new high — eliminating the divergence. This occurs when a new surge of buying momentum enters the market and pushes both price and RSI to new highs simultaneously.
Low-timeframe divergence overwhelmed by higher timeframe trend: A bearish divergence on the 4-hour chart is frequently overwhelmed by a strong bullish trend on the daily or weekly chart. Always check the higher timeframe trend before acting on a divergence signal.
Backtest Details
The statistics on this page are based on a systematic backtest of historical OHLCV data. Below are the full methodology parameters for this pattern.
These statistics represent historical averages on cryptocurrency markets. Results vary by market regime, asset, and confirmation criteria. Past performance does not guarantee future results.
Frequently Asked Questions
What is RSI Bearish Divergence?
RSI Bearish Divergence occurs when price makes a higher high but the RSI indicator makes a lower high. This divergence signals that buying momentum is weakening even as price continues to rise — a potential early warning of a bearish reversal.
How do you identify RSI Bearish Divergence?
On the price chart, identify two successive highs where the second high is higher than the first. On the RSI panel, confirm that the RSI high corresponding to the second price high is lower than the RSI high corresponding to the first price high.
What RSI level makes Bearish Divergence most significant?
RSI Bearish Divergence is most significant when both RSI highs are above 70 (overbought territory). Divergence that forms with RSI peaks between 60–70 is less reliable than divergence with peaks above 70.
How do you trade RSI Bearish Divergence?
Wait for price action confirmation: a bearish candlestick pattern (Shooting Star, Bearish Engulfing), a break below a key support level, or a MACD bearish crossover. Enter short after confirmation with stop-loss above the recent high.
Limitations
This pattern is not a standalone trading signal. Its historical performance depends on market regime, liquidity, volatility, timeframe, and confirmation method. The backtest statistics on this page use historical cryptocurrency data from Binance (BTC/USDT, ETH/USDT, SOL/USDT) and do not predict future performance. Technical analysis is inherently subjective — pattern recognition varies between analysts. Always apply your own judgment, use proper risk management, and consult a qualified financial advisor before making trading decisions. See our full Methodology and Disclaimer.
Common False Positives
RSI Bearish Divergence has a higher false positive rate than most patterns. These are the most common failure scenarios:
RSI Bearish Divergence — Full Backtest Results
We tested 678 occurrences of the RSI Bearish Divergence on BTC/USDT, ETH/USDT, SOL/USDT, and BNB/USDT using Binance historical OHLCV data from 2018 to 2026.