Double Top Pattern
Two consecutive price peaks at approximately the same resistance level, separated by a moderate pullback. Forms after an uptrend and signals that buyers failed twice to break through resistance — often preceding a significant decline.
Ideal Pattern Diagram

Real Chart Examples
Real Double Top formations on major crypto assets. Note that real-world peaks are rarely perfectly equal — a tolerance of 1–3% is normal.


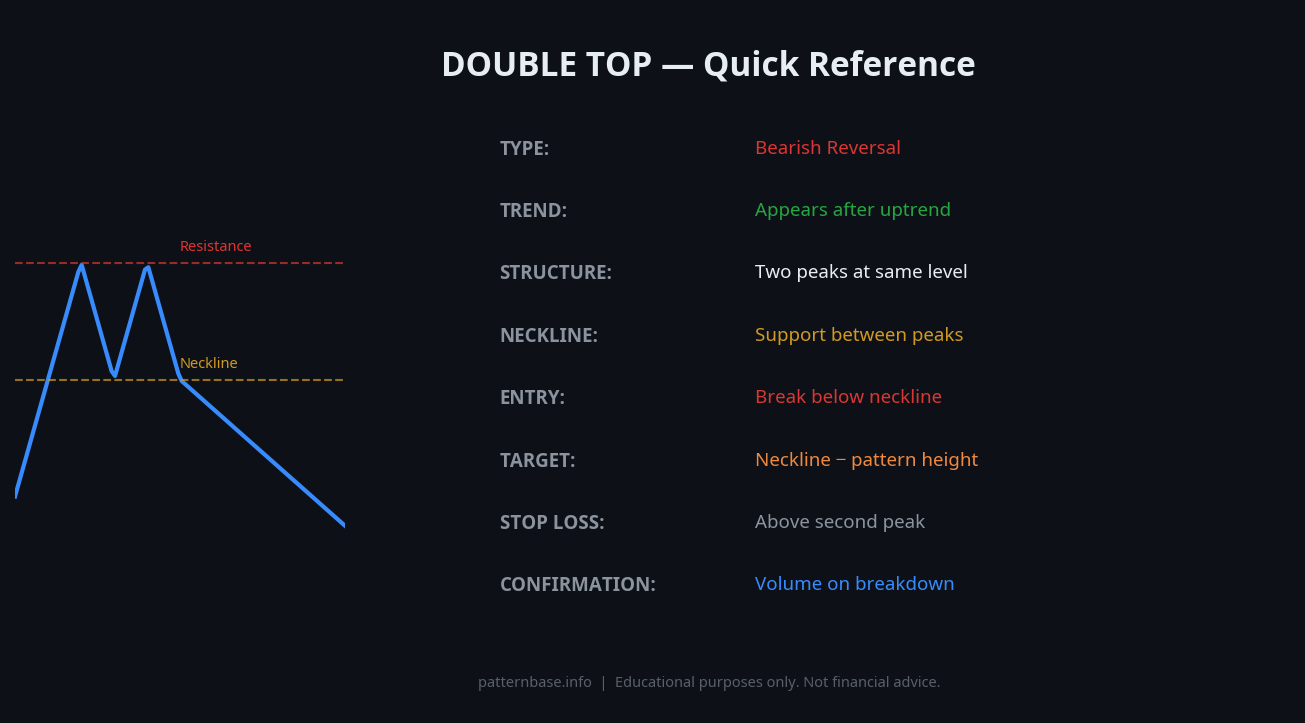
Quick Reference Cheat Sheet

Download the Double Top Cheat Sheet
Save the quick-reference card as an image. Keep it open while you scan charts.
What is the Double Top Pattern?
The Double Top is a bearish reversal chart pattern that forms after a sustained uptrend. It is characterised by two consecutive price peaks at approximately the same level, separated by a moderate trough. The pattern signals that buying momentum is exhausting itself — the market attempted to push higher a second time, failed to break the prior high, and is now vulnerable to a directional shift downward.
The pattern is completed — and considered technically active — only when price closes below the trough that separates the two peaks. This trough level is commonly referred to as the neckline. Until that neckline is broken with conviction, the formation remains unconfirmed and should not be treated as a valid reversal signal. The Double Top appears across all asset classes including equities, forex, commodities, and cryptocurrencies, and is visible on any timeframe from intraday charts to monthly closes.
The projected price target following a confirmed breakdown is calculated by measuring the vertical distance from the neckline to the peak of the pattern, then subtracting that distance from the neckline breakout point. For example, if the peaks form at $50,000 and the neckline sits at $44,000, the distance is $6,000, giving a downside target of approximately $38,000.
How to Identify the Double Top Pattern
To qualify as a valid Double Top, the following structural criteria must be met:
- Two distinct peaks at similar price levels: The two highs should be within approximately 1–3% of each other. A gap larger than 5% between the two peaks weakens the pattern's reliability.
- A clearly defined neckline (trough): The pullback between the two peaks should retrace at least 10–15% from the peak level, creating a visible and identifiable support zone.
- Volume confirmation: Volume is typically higher on the first peak than the second. A noticeably lower-volume second peak suggests weakening buying pressure and strengthens the bearish interpretation.
- Neckline breakdown with follow-through: A daily or weekly close below the neckline — not just an intraday wick — is required for pattern confirmation. A close more than 2–3% below the neckline adds further confidence.
- Time symmetry between peaks: The two peaks should form over a comparable time span. Patterns where one peak develops over 3 days and the other over 3 weeks are structurally asymmetric and less reliable.
- Trend context: The Double Top should form at the end of a measurable uptrend. A pattern that forms during sideways consolidation or after only a minor rally carries significantly less predictive weight.
Pattern Statistics
Based on YouPattern's independent backtest (BTC/USDT, ETH/USDT, SOL/USDT, BNB/USDT — Binance historical OHLCV, 2018–2026) and third-party research by Thomas Bulkowski (Encyclopedia of Chart Patterns, 3rd ed., equity markets):
| Metric | Value |
|---|---|
| Measured move target reached | ~65–70% |
| Average decline after confirmed breakdown | ~18–22% |
| Best performing timeframe | Daily (1D) / Weekly (1W) |
| Failure rate (neckline break fakeout) | ~20–25% |
| Ideal peak-to-peak price difference | < 3% |
| Minimum trough depth from peaks | 10–15% |
Note: These statistics represent historical averages. Individual results vary based on market conditions, asset class, and confirmation criteria applied.
What Does It Signal?
The Double Top pattern reflects a specific sequence of market psychology. During the first peak, buyers push price to a new high, but sellers emerge at that level and drive price back down to the neckline. Buyers regroup and make a second attempt to break above the prior high — but this time, the rally fails. The second peak forms at or near the same resistance zone, indicating that sellers are defending that level with equal or greater force. When price retreats from the second peak and breaks the neckline, it confirms that the balance of power has shifted from buyers to sellers.
This psychology is reinforced by the volume pattern. The declining volume on the second peak suggests that fewer market participants are willing to chase price higher. When the neckline breaks, stop-loss orders from traders who entered during the second rally are triggered, accelerating the downward move. This cascade effect is why confirmed Double Tops can lead to sharp, sustained declines rather than gradual drifts lower.
Double Top vs Similar Patterns
| Pattern | Shape | Signal | Key Difference |
|---|---|---|---|
| Double Top | Two peaks at same level | Bearish reversal | Peaks at resistance, neckline below |
| Double Bottom | Two troughs at same level | Bullish reversal | Mirror image of Double Top |
| Head and Shoulders | Three peaks, middle highest | Bearish reversal | Middle peak higher than shoulders |
| Rising Wedge | Higher highs + higher lows converging | Bearish reversal | Trend lines converge upward |
| Triple Top | Three peaks at same level | Bearish reversal | Stronger signal, rarer pattern |
The Double Bottom is the direct mirror image of the Double Top — same structure, opposite direction. If you understand one, you understand both.
How to Trade the Double Top Pattern
Entry
The most conservative entry is on a confirmed daily close below the neckline. More aggressive traders enter on the first close below the neckline; conservative traders wait for a retest of the neckline from below (now acting as resistance) before entering short.
Stop Loss
Place the stop-loss above the second peak — the level at which the pattern is structurally invalidated. If price breaks above the second peak on strong volume, the Double Top has failed and the prior uptrend may be resuming.
Target
Apply the measured move rule: measure the vertical distance from the neckline to the peaks, then project that distance downward from the neckline breakout point. This gives the minimum expected decline.
Risk Management
Never risk more than 1–2% of account capital on a single pattern trade. The Double Top has a ~65–70% success rate when confirmed — meaning it fails roughly 30% of the time. Position sizing must account for this.
Common Mistakes
- Treating unconfirmed patterns as valid: Entering a trade based on two peaks alone — before the neckline breaks — is one of the most frequent errors. Many potential Double Tops resolve upward and continue the prior trend.
- Ignoring volume: Dismissing volume analysis removes one of the most important confirmation layers. A second peak formed on equal or higher volume than the first significantly weakens the bearish case.
- Measuring the target incorrectly: Applying the measured move from the wrong reference point — such as measuring from a wick rather than the closing price — leads to inaccurate downside projections.
- Misidentifying the neckline: Traders sometimes draw the neckline through a single candle low rather than identifying a zone where price consolidated between the two peaks. A poorly placed neckline produces premature or missed confirmation signals.
- Overlooking the broader trend context: Applying the Double Top pattern in a strongly trending market without considering higher-timeframe structure increases the likelihood of false signals.
- Ignoring the retest: Many traders miss the optimal entry by not waiting for a neckline retest. After the initial breakdown, price often pulls back to the neckline from below — this retest provides a lower-risk entry with a tighter stop.
When the Pattern Fails
The Double Top fails most commonly when price breaks above the second peak by more than 3% on strong volume. This invalidates the resistance level and signals a continuation of the prior uptrend rather than a reversal.
The pattern also produces false signals in low-liquidity environments or during major macroeconomic news events, where price can temporarily breach the neckline before snapping back above it. A confirmed breakdown that is immediately reclaimed within one or two candles — sometimes called a "fakeout" — is a strong indicator of pattern failure.
Finally, if the trough between the two peaks is shallow — less than 8% from the peak — the pattern lacks the structural depth to represent a meaningful shift in supply and demand. Shallow Double Tops in choppy, range-bound markets frequently resolve as continuation patterns rather than reversals.
Backtest Details
The statistics on this page are based on a systematic backtest of historical OHLCV data. Below are the full methodology parameters for this pattern.
These statistics represent historical averages on cryptocurrency markets. Results vary by market regime, asset, and confirmation criteria. Past performance does not guarantee future results.
Frequently Asked Questions
What is the Double Top pattern?
The Double Top is a bearish reversal chart pattern consisting of two consecutive peaks at approximately the same price level, separated by a trough. It signals the end of an uptrend and a potential price decline when price breaks below the neckline (the trough between the two peaks).
How do you trade the Double Top pattern?
Enter short when price breaks and closes below the neckline. Place stop-loss above the second peak. The measured move target is calculated by subtracting the height from the peaks to the neckline from the neckline breakout point.
How long does a Double Top take to form?
A valid Double Top typically takes weeks to months to form on daily charts. The two peaks should be separated by at least 2–4 weeks. Patterns that form in just a few days are less reliable.
What is the difference between Double Top and Head and Shoulders?
The Double Top has two equal peaks. The Head and Shoulders has three peaks with the middle (head) higher than the two shoulders. Both are bearish reversal patterns, but Head and Shoulders is generally considered more reliable.
Limitations
This pattern is not a standalone trading signal. Its historical performance depends on market regime, liquidity, volatility, timeframe, and confirmation method. The backtest statistics on this page use historical cryptocurrency data from Binance (BTC/USDT, ETH/USDT, SOL/USDT, BNB/USDT) and do not predict future performance. Technical analysis is inherently subjective — pattern recognition varies between analysts. Always apply your own judgment, use proper risk management, and consult a qualified financial advisor before making trading decisions. See our full Methodology and Disclaimer.
Common False Positives
The Double Top is one of the most misidentified patterns. These scenarios produce the most false signals: