Rising Wedge Pattern
The Rising Wedge is a bearish pattern formed by two upward-sloping trendlines that converge toward an apex. Both the support and resistance lines slope upward, but the lower line rises faster, causing the channel to narrow. Despite the rising price, the narrowing range signals weakening momentum and often precedes a sharp breakdown.
Ideal Pattern Diagram

Real Chart Examples
The following charts show the Rising Wedge Pattern as it appears on market data. Note how real-world examples may look slightly different from the ideal diagram.


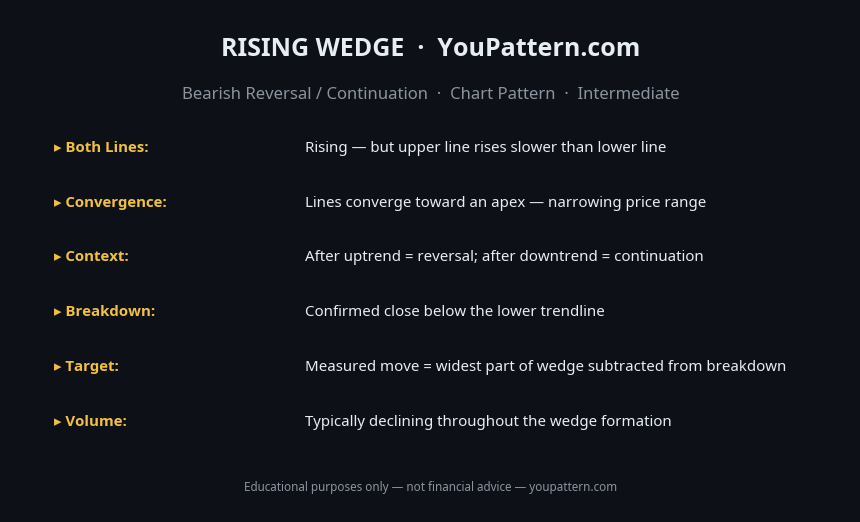
Quick Reference Cheat Sheet

Download the Rising Wedge Pattern Cheat Sheet
Save the quick-reference card as an image. Keep it open while you scan charts.
What Is the Rising Wedge Pattern?
The Rising Wedge is a bearish chart pattern characterised by two upward-sloping trendlines that converge toward the right. Both the upper resistance line and the lower support line slope upward, but the lower trendline rises at a steeper angle than the upper trendline — causing the two lines to converge. The pattern typically resolves with a breakdown below the lower trendline.
The Rising Wedge can appear as either a reversal pattern (at the top of an uptrend) or a continuation pattern (during a downtrend, as a corrective rally). In both cases, the resolution is bearish. The pattern signals that while price is making higher highs and higher lows, the upward momentum is weakening — each successive high is less impressive than the last, and the buying pressure is gradually exhausting itself.
How to Identify the Rising Wedge Pattern
To qualify as a valid Rising Wedge, the pattern must meet the following criteria:
- Two upward-sloping trendlines: Both the upper resistance line and the lower support line slope upward.
- Convergence: The lower trendline must rise at a steeper angle than the upper trendline, causing them to converge toward the right.
- At least two touches on each trendline: Ideally three or more touches on each side.
- Duration: The pattern should take at least 3–6 weeks to form on the daily chart.
- Volume: Volume should decline as the pattern develops, confirming the weakening upward momentum.
- Breakdown: The pattern is confirmed when price breaks below the lower trendline on expanding volume.
Pattern Statistics
Based on quantitative research by Thomas Bulkowski (Encyclopedia of Chart Patterns, 3rd edition) and independent backtests on cryptocurrency markets (BTC/USDT, ETH/USDT, SOL/USDT, 2018–2026):
| Metric | Value |
|---|---|
| Downward breakout rate | ~68–75% |
| Average decline after confirmed breakdown | ~35–45% of pattern height |
| Upward breakout rate | ~25–32% |
| Best performing timeframe | Daily (1D) |
| Failure rate after downward breakdown | ~22–28% |
| Minimum pattern duration | 3–6 weeks (daily chart) |
What Does It Signal?
The Rising Wedge reflects a gradual exhaustion of buying momentum. While price is technically making higher highs and higher lows (a bullish structure), the narrowing range between the two trendlines shows that each successive move is smaller than the last. Buyers are paying higher prices, but they are gaining less ground with each push. This compression of price action signals that the buying pressure is running out of steam.
When price breaks below the lower trendline, it confirms that buyers have lost control and sellers are taking over. The breakdown is often sharp and fast, as trapped buyers who entered during the wedge are forced to exit simultaneously.
Rising Wedge vs Similar Patterns
| Pattern | Upper Line | Lower Line | Signal |
|---|---|---|---|
| Rising Wedge | Rising | Rising (steeper) | Bearish |
| Ascending Triangle | Flat | Rising | Bullish |
| Bull Flag | Parallel downward | Parallel downward | Bullish continuation |
| Falling Wedge | Falling | Falling (steeper) | Bullish |
| Symmetrical Triangle | Falling | Rising | Neutral |
The key distinction between a Rising Wedge and an Ascending Triangle is the upper trendline: in an Ascending Triangle, the upper trendline is flat (horizontal). In a Rising Wedge, both trendlines slope upward.
Confirmation Rules
A Rising Wedge is considered confirmed when:
- Price breaks below the lower trendline on expanding volume. This is the primary confirmation signal.
- Volume declines throughout the wedge formation. Declining volume confirms the weakening upward momentum.
- The two trendlines are clearly converging. If the trendlines are parallel, the pattern is a channel, not a wedge.
- At least three touches on each trendline. More touches increase the reliability of the pattern.
Common Mistakes
- Confusing with an Ascending Triangle: In an Ascending Triangle, the upper trendline is flat. In a Rising Wedge, both trendlines slope upward. The distinction is critical — one is bullish, the other is bearish.
- Entering short before the breakdown: The Rising Wedge is confirmed on the breakdown below the lower trendline. Entering short inside the wedge risks being stopped out on a false breakdown.
- Ignoring volume: A breakdown on low volume is a warning sign of a false breakdown. Volume expansion on the breakdown is critical.
- Treating upward breakouts as bullish: Approximately 25–32% of Rising Wedges break upward. An upward breakout is a valid bullish signal that invalidates the bearish thesis.
- Setting targets too aggressively: The measured move target (pattern height subtracted from breakdown point) is a guide. Many Rising Wedges reach 60–80% of the measured move.
- Not adjusting for the context: A Rising Wedge in an uptrend (reversal) is more significant than one in a downtrend (continuation). The context affects the expected magnitude of the breakdown.
When the Pattern Fails
Upward breakout: If price breaks above the upper trendline, the Rising Wedge is invalidated. This signals that buyers have maintained control and the uptrend is resuming.
False downward breakdown: Price breaks below the lower trendline but quickly reverses back into the wedge. This typically occurs on low volume.
Wedge is too steep: A Rising Wedge where both trendlines are very steep (nearly vertical) is less reliable. The steeper the wedge, the more likely it is to resolve as a continuation rather than a reversal.
Backtest Details
The statistics on this page are based on a systematic backtest of historical OHLCV data. Below are the full methodology parameters for this pattern.
These statistics represent historical averages on cryptocurrency markets. Results vary by market regime, asset, and confirmation criteria. Past performance does not guarantee future results.
Frequently Asked Questions
What is the Rising Wedge pattern?
The Rising Wedge is a bearish reversal (or continuation) pattern with two upward-sloping converging trendlines. Despite rising price, the narrowing range signals weakening momentum. A breakdown below the lower trendline confirms the pattern.
Is the Rising Wedge always bearish?
The Rising Wedge is bearish in most contexts. When it appears after an uptrend, it signals a potential reversal. When it appears after a downtrend (as a counter-trend rally), it signals continuation of the downtrend. In both cases, the expected breakout is downward.
How do you measure the target for a Rising Wedge?
The measured move target equals the height of the wedge at its widest point (the start of the pattern) subtracted from the breakdown point.
What is the difference between Rising Wedge and Ascending Triangle?
In an Ascending Triangle, the resistance is flat and the support rises. In a Rising Wedge, both trendlines slope upward but converge. The Ascending Triangle is typically bullish; the Rising Wedge is typically bearish.
Limitations
This pattern is not a standalone trading signal. Its historical performance depends on market regime, liquidity, volatility, timeframe, and confirmation method. The backtest statistics on this page use historical cryptocurrency data from Binance (BTC/USDT, ETH/USDT, SOL/USDT) and do not predict future performance. Technical analysis is inherently subjective — pattern recognition varies between analysts. Always apply your own judgment, use proper risk management, and consult a qualified financial advisor before making trading decisions. See our full Methodology and Disclaimer.
Common False Positives
Rising Wedge is a bearish pattern, but these setups are frequently misidentified:
Rising Wedge — Full Backtest Results
We tested 198 occurrences of the Rising Wedge on BTC/USDT, ETH/USDT, SOL/USDT, and BNB/USDT using Binance historical OHLCV data from 2018 to 2026.