Bear Flag Pattern
The Bear Flag is a bearish continuation pattern consisting of a sharp, near-vertical price decline (the flagpole) followed by a brief consolidation period that drifts slightly upward or sideways (the flag). The pattern signals that the strong downward move is likely to continue after the brief pause.
Ideal Pattern Diagram

Real Chart Examples
The following charts show the Bear Flag Pattern as it appears on market data. Note how real-world examples may look slightly different from the ideal diagram.


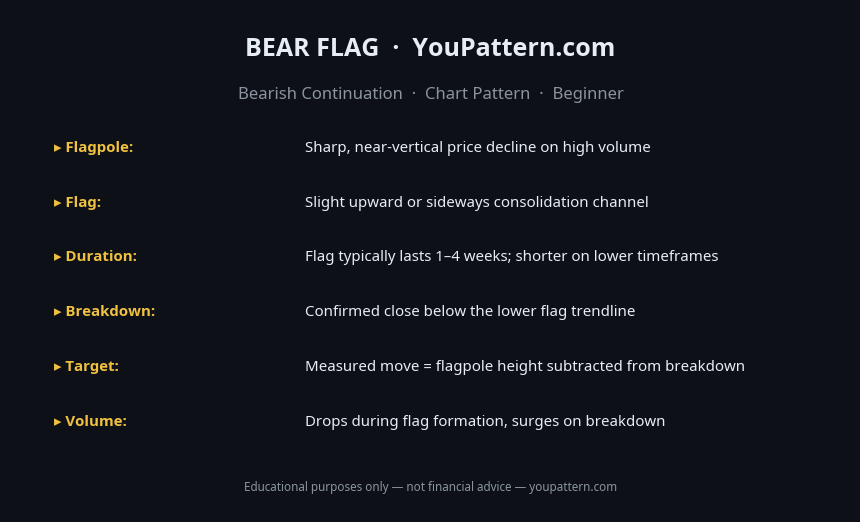
Quick Reference Cheat Sheet

Download the Bear Flag Pattern Cheat Sheet
Save the quick-reference card as an image. Keep it open while you scan charts.
What Is the Bear Flag Pattern?
The Bear Flag is a bearish continuation pattern that forms after a strong, sharp downward price move (the "flagpole"). It consists of a brief consolidation phase where price moves sideways or slightly upward in a parallel channel (the "flag"), followed by a breakdown in the direction of the original move. The Bear Flag is the mirror image of the Bull Flag.
The Bear Flag represents a brief pause in a strong downtrend, during which the market consolidates before resuming the downward move. The pattern is most significant when the flagpole is steep and formed on high volume, when the flag consolidation is orderly and on declining volume, and when the breakdown occurs on expanding volume.
How to Identify the Bear Flag Pattern
To qualify as a valid Bear Flag, the pattern must meet the following criteria:
- Flagpole: A strong, sharp downward price move on high volume. The flagpole should be steep — ideally a 20–50% decline or more in a short period.
- Flag: A brief consolidation phase where price moves in a parallel upward-sloping channel. The flag should retrace no more than 38–50% of the flagpole.
- Duration: The flag consolidation should last 5–20 candles on the timeframe being analysed.
- Volume: Volume should decline during the flag consolidation — this shows that buying pressure is weak and the pullback is a pause, not a reversal.
- Breakdown: The pattern is confirmed when price breaks below the lower trendline of the flag channel on expanding volume.
Pattern Statistics
Based on quantitative research by Thomas Bulkowski (Encyclopedia of Chart Patterns, 3rd edition) and independent backtests on cryptocurrency markets (BTC/USDT, ETH/USDT, SOL/USDT, 2018–2026):
| Metric | Value |
|---|---|
| Confirmed breakdown success rate | ~67–73% |
| Average decline after confirmed breakdown (measured move) | ~80–100% of flagpole height |
| Best performing timeframe | 4H and Daily (1D) |
| Failure rate after breakdown | ~27–33% |
| Maximum flag retracement | 38–50% of flagpole |
| Ideal flag duration | 5–15 candles |
What Does It Signal?
The Bear Flag represents a healthy pause in a strong downtrend. After a sharp move lower (the flagpole), the market pauses to consolidate — short-covering by early sellers creates the slight upward drift of the flag. However, the declining volume during the consolidation shows that buyers are not aggressively pushing price higher. When sellers re-enter the market and break below the flag's lower trendline, the downtrend resumes.
Bear Flag vs Similar Patterns
| Pattern | Shape | Type | Signal |
|---|---|---|---|
| Bear Flag | Flagpole + upward channel | Continuation | Bearish |
| Bull Flag | Flagpole + downward channel | Continuation | Bullish |
| Bear Pennant | Flagpole + converging triangle | Continuation | Bearish |
| Descending Triangle | Flat bottom + falling top | Continuation/Reversal | Bearish |
| Rising Wedge | Converging upward trendlines | Reversal/Continuation | Bearish |
Confirmation Rules
A Bear Flag is considered confirmed when:
- Price breaks below the lower trendline of the flag channel on expanding volume. This is the primary confirmation signal.
- The flag retraces no more than 38–50% of the flagpole. A deeper retracement suggests the pattern may be a reversal.
- Volume declines during the flag and expands on the breakdown. This volume profile is the hallmark of a valid Bear Flag.
- The flagpole is steep and formed on high volume. A gradual flagpole weakens the pattern significantly.
Common Mistakes
- Entering during the flag consolidation: The entry is on the breakdown below the flag's lower trendline, not during the consolidation.
- Accepting a flag that retraces too deeply: A flag that retraces more than 50% of the flagpole is a warning sign.
- Ignoring volume during the flag: A flag on expanding volume suggests buyers are actively pushing price higher — a bullish sign, not a healthy bearish consolidation.
- Confusing with an ascending channel: A Bear Flag is a brief, orderly consolidation after a sharp decline. An ascending channel that forms without a clear flagpole is a different pattern.
- Setting targets too aggressively: The measured move target is a guide. In cryptocurrency markets, targets are often reached but not always in a straight line.
- Not adjusting for the timeframe: Higher timeframe Bear Flags are more reliable and produce larger moves.
When the Pattern Fails
Flag retracement exceeds 50% of flagpole: When price retraces more than half of the flagpole during the flag consolidation, the pattern loses its continuation characteristics.
Breakdown on low volume: A breakdown below the flag's lower trendline on declining or below-average volume is a warning sign of a false breakdown.
Flag duration extends too long: When the flag consolidation lasts more than 20–25 candles, the market's momentum has dissipated. Extended flags frequently resolve as reversals rather than continuations.
Backtest Details
The statistics on this page are based on a systematic backtest of historical OHLCV data. Below are the full methodology parameters for this pattern.
These statistics represent historical averages on cryptocurrency markets. Results vary by market regime, asset, and confirmation criteria. Past performance does not guarantee future results.
Frequently Asked Questions
What is the Bear Flag pattern?
The Bear Flag is a bearish continuation pattern consisting of a sharp downward move (flagpole) followed by a slight upward consolidation channel (flag). The flag typically retraces 30–50% of the flagpole. A breakdown below the flag's lower trendline signals continuation of the downward move.
How do you measure the target for a Bear Flag?
The measured move target equals the length of the flagpole subtracted from the breakdown point from the flag's lower trendline.
What makes a Bear Flag more reliable?
Reliability increases when: the flagpole is steep (45°+), volume decreases during the flag consolidation and increases on the breakdown, the flag retraces no more than 50% of the flagpole, and the flag forms over 1–3 weeks.
What is the difference between Bear Flag and Descending Triangle?
The Bear Flag has a clear flagpole (sharp prior decline) and a parallel channel consolidation. The Descending Triangle has a flat support and falling resistance, forming over a longer period without a clear flagpole.
Limitations
This pattern is not a standalone trading signal. Its historical performance depends on market regime, liquidity, volatility, timeframe, and confirmation method. The backtest statistics on this page use historical cryptocurrency data from Binance (BTC/USDT, ETH/USDT, SOL/USDT) and do not predict future performance. Technical analysis is inherently subjective — pattern recognition varies between analysts. Always apply your own judgment, use proper risk management, and consult a qualified financial advisor before making trading decisions. See our full Methodology and Disclaimer.
Common False Positives
Bear Flag is a continuation pattern that frequently produces false signals in these conditions:
Bear Flag — Full Backtest Results
We tested 589 occurrences of the Bear Flag on BTC/USDT, ETH/USDT, SOL/USDT, and BNB/USDT using Binance historical OHLCV data from 2018 to 2026.