Bullish Engulfing Pattern
The Bullish Engulfing pattern consists of two candles: a smaller bearish candle followed by a larger bullish candle whose body completely engulfs the previous candle's body. It signals that buyers have overwhelmed sellers and a reversal from a downtrend may be underway.
Ideal Pattern Diagram

Real Chart Examples
The following charts show the Bullish Engulfing Pattern as it appears on market data. Note how real-world examples may look slightly different from the ideal diagram.


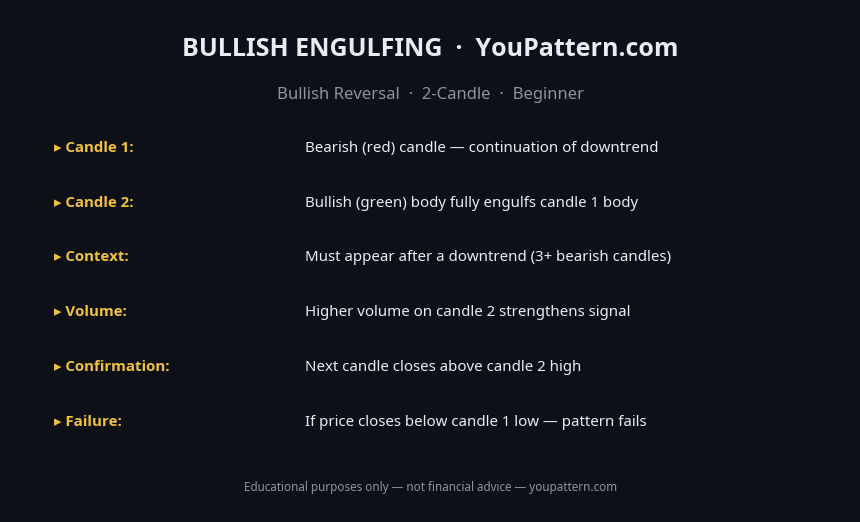
Quick Reference Cheat Sheet

Download the Bullish Engulfing Pattern Cheat Sheet
Save the quick-reference card as an image. Keep it open while you scan charts.
What Is the Bullish Engulfing Pattern?
The Bullish Engulfing is a two-candle bullish reversal pattern that appears at the bottom of a downtrend. It consists of a smaller bearish (red) candle on day one, followed by a larger bullish (green) candle on day two whose real body completely engulfs the body of the first candle. The second candle opens below the first candle's close and closes above the first candle's open — a full body engulfment that signals a decisive shift from sellers to buyers.
The pattern is most significant when it appears after a sustained downtrend of at least three to five bearish candles, or when it forms at a well-established support level, a prior swing low, or a round-number price zone. A Bullish Engulfing that forms in the middle of a trading range or during sideways consolidation carries substantially less analytical weight.
The Bullish Engulfing is one of the most widely recognised and statistically validated two-candle reversal formations in technical analysis. It is the mirror image of the Bearish Engulfing pattern and appears consistently across all asset classes and timeframes.
How to Identify the Bullish Engulfing Pattern
To qualify as a valid Bullish Engulfing, both candles must meet all of the following structural criteria:
- First candle: A bearish (red/black) candle. The body should be relatively small — a large first candle makes it harder for the second candle to achieve full engulfment.
- Second candle opens below the first candle's close: The gap down (or at minimum an equal open) is required.
- Second candle's body fully engulfs the first candle's body: The second candle's open must be lower than the first candle's close, and the second candle's close must be higher than the first candle's open. Only body engulfment is required — not wick-to-wick.
- Second candle is bullish (green/white): The close of the second candle must be above its open.
- Trend context: The pattern must appear after a prior downtrend. At minimum, price should have declined noticeably over the preceding 3–10 candles.
- Volume: Higher volume on the second (bullish) candle significantly strengthens the signal. Volume 1.5× or more the 20-period average is a meaningful supporting factor.
Pattern Statistics
Based on quantitative research by Thomas Bulkowski (Encyclopedia of Chart Patterns, 3rd edition) and independent backtests on cryptocurrency markets (BTC/USDT, ETH/USDT, SOL/USDT, 2018–2026):
| Metric | Value |
|---|---|
| Confirmed reversal rate (daily timeframe) | ~63–68% |
| Average gain after confirmed signal (30 days) | ~5–9% |
| Best performing timeframe | Daily (1D) |
| Failure rate without confirmation candle | ~40% |
| Strongest signal context | At support + declining volume on prior downtrend |
| Minimum prior downtrend length | 3–5 candles |
Note: Statistics represent historical averages on cryptocurrency markets. Results vary significantly based on market conditions, asset liquidity, and confirmation criteria applied.
What Does It Signal?
The Bullish Engulfing reflects a dramatic intraday shift in market sentiment. On the first day, sellers maintain control and close the session with a loss. On the second day, sellers initially push price lower (the gap down open), but buyers overwhelm them completely — not only erasing the first day's losses but closing above the first day's open. The full body engulfment is a visual representation of buyers decisively taking control.
The psychology behind the pattern is a failure of bearish momentum at a critical level. The sellers who drove the prior downtrend attempt to continue on the second day, but encounter a wall of buying that reverses the entire prior session's move. The larger the second candle's body relative to the first, the more decisive the reversal signal.
Bullish Engulfing vs Similar Patterns
| Pattern | Candles | Key Difference | Signal Strength |
|---|---|---|---|
| Bullish Engulfing | 2 candles | Full body engulfment at downtrend bottom | Strong |
| Bearish Engulfing | 2 candles | Mirror image — at uptrend top | Strong (bearish) |
| Piercing Line | 2 candles | Second candle closes into (not above) first body | Moderate |
| Morning Star | 3 candles | Gap down + small body + gap up close | Very strong |
| Hammer | 1 candle | Long lower shadow at downtrend bottom | Moderate |
| Bullish Harami | 2 candles | Second candle body is inside first body | Weak |
The key distinction between Bullish Engulfing and Piercing Line is the degree of penetration: in Piercing Line, the second candle closes into the first candle's body but not above its open. In Bullish Engulfing, the second candle closes above the first candle's open — a more decisive reversal signal.
Confirmation Rules
A Bullish Engulfing is considered confirmed when:
- The candle following the pattern closes above the Bullish Engulfing's high. A third bullish close confirms that buyers have maintained control.
- Volume on the second (bullish) candle is above average. Ideally 1.5× the 20-period average volume or higher. High volume indicates institutional participation.
- The pattern forms at or near a recognised support level — prior swing low, moving average, Fibonacci retracement level, or round-number price zone.
- The prior downtrend shows signs of exhaustion — declining volume on the final bearish candles, narrowing candle bodies, or multiple failed attempts to break below a support level.
Common Mistakes
- Requiring wick engulfment: The standard definition requires only body engulfment. Requiring wick engulfment eliminates the majority of valid signals.
- Ignoring the downtrend requirement: A Bullish Engulfing in an uptrend or sideways market is not a reversal signal. The pattern requires a prior downtrend to carry analytical meaning.
- Acting before confirmation: Entering a long position immediately when the Bullish Engulfing candle closes, without waiting for the following candle to confirm, increases the false signal rate significantly.
- Treating all engulfing patterns equally: A Bullish Engulfing where the second candle is only marginally larger than the first is a weaker signal than one where the second candle is 2–3× the size of the first. The degree of engulfment matters.
- Ignoring volume: A Bullish Engulfing on declining volume is a much weaker signal than one accompanied by a volume spike. Low-volume engulfing patterns frequently resolve as false signals.
- Confusing with the Bullish Harami: The Bullish Harami has the second candle body inside the first. The Bullish Engulfing has the second candle outside (engulfing) the first. These are completely different patterns with different reliability profiles.
When the Pattern Fails
Immediate reversal on the third candle: If the candle following the Bullish Engulfing closes below the midpoint of the second candle's body, the reversal signal is weakening. If it closes below the second candle's open, the pattern is invalidated.
Formation in a strong, momentum-driven downtrend: When price is in a steep, high-momentum decline — visible through a sharp angle of descent, expanding bearish candles, and high volume — a single Bullish Engulfing is frequently overwhelmed by continued selling pressure.
Absence of a nearby support structure: A Bullish Engulfing that forms in open price space, with no prior swing lows, moving averages, or volume-by-price nodes nearby, lacks the technical context that gives the pattern its analytical basis.
Backtest Details
The statistics on this page are based on a systematic backtest of historical OHLCV data. Below are the full methodology parameters for this pattern.
These statistics represent historical averages on cryptocurrency markets. Results vary by market regime, asset, and confirmation criteria. Past performance does not guarantee future results.
Frequently Asked Questions
What is the Bullish Engulfing pattern?
The Bullish Engulfing is a 2-candle reversal pattern where a green (bullish) candle's body fully engulfs the previous red (bearish) candle's body. It appears at the bottom of downtrends and signals that buyers have overwhelmed sellers.
How do you identify a Bullish Engulfing pattern?
Look for: (1) a downtrend of at least 3–5 candles; (2) a bearish (red) candle; (3) a bullish (green) candle that opens below the prior close and closes above the prior open, fully engulfing the prior body.
What is the difference between Bullish Engulfing and Piercing Line?
Both are 2-candle bullish reversals, but the Bullish Engulfing requires the green candle to fully engulf the red candle's body, while the Piercing Line only requires the green candle to close above the 50% midpoint of the red candle.
Does volume confirm the Bullish Engulfing pattern?
Yes. A Bullish Engulfing pattern is significantly more reliable when the engulfing candle has higher volume than the prior bearish candle. High volume confirms that buyers entered with conviction.
Limitations
This pattern is not a standalone trading signal. Its historical performance depends on market regime, liquidity, volatility, timeframe, and confirmation method. The backtest statistics on this page use historical cryptocurrency data from Binance (BTC/USDT, ETH/USDT, SOL/USDT) and do not predict future performance. Technical analysis is inherently subjective — pattern recognition varies between analysts. Always apply your own judgment, use proper risk management, and consult a qualified financial advisor before making trading decisions. See our full Methodology and Disclaimer.
Common False Positives
Bullish Engulfing patterns frequently fail when these conditions are present:
Bullish Engulfing — Full Backtest Results
We tested 847 occurrences of the Bullish Engulfing on BTC/USDT, ETH/USDT, SOL/USDT, and BNB/USDT using Binance historical OHLCV data from 2018 to 2026.