Doji Candlestick Pattern
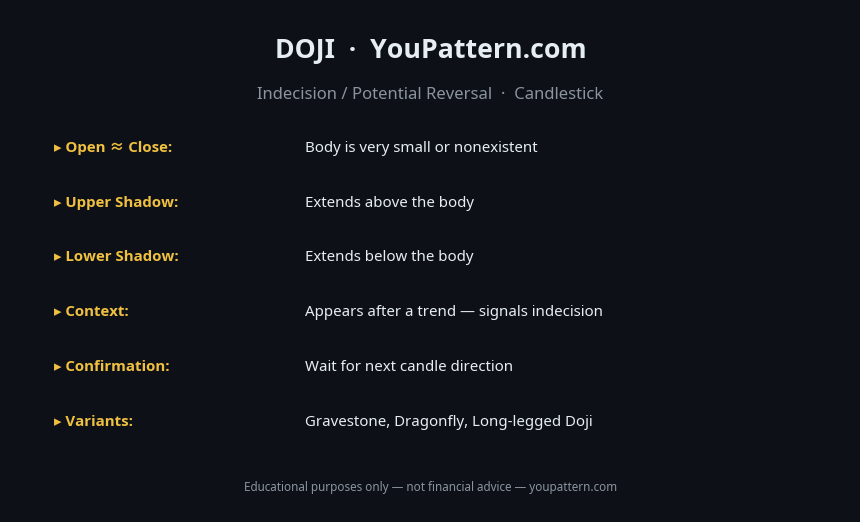
A Doji forms when the opening and closing prices are nearly identical, leaving a very small or nonexistent real body. The long upper and lower shadows show that both buyers and sellers pushed price significantly in both directions before settling near the open — a classic sign of market indecision.
Ideal Pattern Diagram

Real Chart Examples
The following charts show the Doji Candlestick Pattern as it appears on market data. Note how real-world examples may look slightly different from the ideal diagram.


Quick Reference Cheat Sheet

Download the Doji Candlestick Pattern Cheat Sheet
Save the quick-reference card as an image. Keep it open while you scan charts.
What Is the Doji Candlestick Pattern?
The Doji is a single-candle pattern characterised by a very small real body — meaning the open and close prices are equal or nearly equal — with upper and lower shadows of varying lengths. The Doji represents a session in which neither buyers nor sellers were able to gain a decisive advantage, resulting in a standoff that closes near the opening price.
The Doji is not inherently bullish or bearish on its own. Its significance depends entirely on context: where it appears in the trend, what precedes it, and what follows it. A Doji appearing after a prolonged uptrend signals that bullish momentum may be exhausting. A Doji at the bottom of a downtrend signals that bearish momentum may be fading. In both cases, the pattern warns of a potential reversal — but confirmation from the following candle is required before acting.
There are several Doji variants, each with slightly different implications: the Standard Doji (equal shadows), the Long-Legged Doji (very long shadows on both sides), the Gravestone Doji (long upper shadow, no lower shadow — bearish), and the Dragonfly Doji (long lower shadow, no upper shadow — bullish).
How to Identify the Doji Candlestick Pattern
To qualify as a valid Doji, a candle must meet the following criteria:
- Real body: The real body must be very small — typically less than 5–10% of the total candle range from high to low. Ideally, open and close are identical or within 1–2 ticks of each other.
- Shadows: Upper and lower shadows can be of any length. The presence and relative length of shadows determines the Doji variant.
- Trend context: The Doji carries the most analytical weight when it appears at the end of a sustained trend — either up or down. A Doji in a sideways market is simply noise.
- Volume: A Doji on high volume is more significant than one on low volume, as high volume indicates that many participants were active but neither side could gain control.
Doji Variants:
| Variant | Shadow Profile | Signal |
|---|---|---|
| Standard Doji | Equal upper and lower shadows | Indecision |
| Long-Legged Doji | Very long upper and lower shadows | Strong indecision |
| Gravestone Doji | Long upper shadow, no lower shadow | Bearish reversal signal |
| Dragonfly Doji | Long lower shadow, no upper shadow | Bullish reversal signal |
Pattern Statistics
Based on quantitative research by Thomas Bulkowski (Encyclopedia of Chart Patterns, 3rd edition) and independent backtests on cryptocurrency markets (BTC/USDT, ETH/USDT, SOL/USDT, 2018–2026):
| Metric | Value |
|---|---|
| Reversal rate after Doji at trend top (daily) | ~52–58% |
| Reversal rate after Doji at trend bottom (daily) | ~53–59% |
| Best performing variant | Dragonfly Doji (bullish) / Gravestone Doji (bearish) |
| Failure rate without confirmation candle | ~48–52% |
| Strongest signal context | After 5+ candle trend + at support/resistance |
Note: The standard Doji has a near-random reversal rate without confirmation. The Dragonfly and Gravestone variants are meaningfully more reliable.
What Does It Signal?
The Doji represents a temporary equilibrium between buyers and sellers. During the session, price moved in both directions (as shown by the shadows) but ultimately returned to near the opening price. This inability to close away from the open signals that the dominant force in the prior trend is losing conviction.
At the top of an uptrend, a Doji signals that buyers who have been in control are no longer able to push price higher and hold the gains. At the bottom of a downtrend, it signals that sellers are losing their ability to drive price lower. In both cases, the Doji is a warning — not a confirmed signal — that the trend may be reversing.
Doji vs Similar Patterns
| Pattern | Body | Location | Signal |
|---|---|---|---|
| Standard Doji | Near-zero body | Any trend end | Indecision |
| Dragonfly Doji | Near-zero body, long lower shadow | Downtrend bottom | Bullish reversal |
| Gravestone Doji | Near-zero body, long upper shadow | Uptrend top | Bearish reversal |
| Spinning Top | Small but visible body | Any trend end | Indecision (weaker) |
| Hammer | Small body at top of candle range | Downtrend bottom | Bullish reversal |
| Shooting Star | Small body at bottom of candle range | Uptrend top | Bearish reversal |
Confirmation Rules
A Doji is considered a valid reversal signal when:
- The following candle confirms the direction. For a bearish reversal: the next candle closes below the Doji's low. For a bullish reversal: the next candle closes above the Doji's high.
- The Doji appears at the end of a clear trend — not in the middle of a range or sideways consolidation.
- The Doji forms at a recognisable support or resistance level — prior swing high/low, moving average, or Fibonacci level.
- Volume on the Doji candle is above average — indicating that many participants were active but neither side could gain control.
Common Mistakes
- Treating every Doji as a reversal signal: A Doji in a sideways market is simply noise. The pattern only carries meaning at the end of a clear trend.
- Acting on the Doji without confirmation: The Doji itself does not confirm a reversal — it only signals indecision. Always wait for the following candle to close in the expected direction before acting.
- Ignoring the Doji variant: A Standard Doji and a Dragonfly Doji have very different implications. The Dragonfly (long lower shadow) is a much stronger bullish signal than a Standard Doji.
- Confusing with a Spinning Top: A Spinning Top has a small but visible real body, while a Doji has a near-zero body. The distinction matters: a Doji represents a perfect standoff; a Spinning Top represents near-indecision.
- Using Doji in isolation on low-timeframe charts: On 1-minute or 5-minute charts, Doji candles are extremely common and carry almost no predictive value. The pattern is most reliable on daily and weekly timeframes.
- Ignoring the prior trend length: A Doji after a 2-candle move is far less meaningful than a Doji after a 10-candle trend. The longer and more sustained the prior trend, the more significant the Doji's indecision signal.
When the Pattern Fails
No follow-through on the confirmation candle: If the candle following the Doji closes in the same direction as the prior trend (rather than reversing), the Doji was simply a pause, not a reversal signal. This is the most common failure mode.
Doji in a strong trending market: In a high-momentum trend with expanding candle bodies and increasing volume, a single Doji is frequently absorbed by the dominant trend. Patterns forming against a dominant trend without structural support or resistance nearby carry a meaningfully higher failure rate.
Multiple consecutive Doji candles: When several Doji candles appear in a row, the market is in a low-volatility consolidation phase. These Doji candles do not carry reversal significance — they simply reflect a lack of directional conviction that will eventually resolve in a breakout in either direction.
Backtest Details
The statistics on this page are based on a systematic backtest of historical OHLCV data. Below are the full methodology parameters for this pattern.
These statistics represent historical averages on cryptocurrency markets. Results vary by market regime, asset, and confirmation criteria. Past performance does not guarantee future results.
Frequently Asked Questions
What is a Doji candlestick?
A Doji forms when the opening and closing prices are nearly identical, leaving a very small or nonexistent real body. The long shadows show that both buyers and sellers pushed price significantly in both directions before settling near the open — a classic sign of market indecision.
Is a Doji bullish or bearish?
A Doji is neutral by itself — it signals indecision rather than a directional bias. Its meaning depends on context: a Doji after a downtrend can be bullish (buyers resisting further decline), while a Doji after an uptrend can be bearish (sellers beginning to challenge the rally).
How do you trade a Doji candlestick?
Never trade a Doji in isolation. Wait for the next candle to confirm direction. If the Doji appears at a key support level after a downtrend and is followed by a bullish candle, consider a long entry. If it appears at resistance after an uptrend and is followed by a bearish candle, consider a short entry.
What is the difference between a Doji and a Spinning Top?
Both have small bodies, but a Doji has an extremely small or nonexistent body (open ≈ close), while a Spinning Top has a slightly larger body. Both signal indecision, but the Doji is considered a stronger indecision signal.
Limitations
This pattern is not a standalone trading signal. Its historical performance depends on market regime, liquidity, volatility, timeframe, and confirmation method. The backtest statistics on this page use historical cryptocurrency data from Binance (BTC/USDT, ETH/USDT, SOL/USDT) and do not predict future performance. Technical analysis is inherently subjective — pattern recognition varies between analysts. Always apply your own judgment, use proper risk management, and consult a qualified financial advisor before making trading decisions. See our full Methodology and Disclaimer.
Common False Positives
Doji candles are among the most misused patterns. These setups are frequently mistaken for valid Doji signals:
Doji Candlestick — Full Backtest Results
We tested 1,340 occurrences of the Doji Candlestick on BTC/USDT, ETH/USDT, SOL/USDT, and BNB/USDT using Binance historical OHLCV data from 2018 to 2026.