Evening Star Pattern
The Evening Star is a three-candle bearish reversal pattern. It begins with a large bullish candle, followed by a small-bodied candle (the 'star') that gaps up, and concludes with a large bearish candle that closes below the midpoint of the first candle. It signals that buying pressure has exhausted and sellers are taking control.
Ideal Pattern Diagram

Real Chart Examples
The following charts show the Evening Star Pattern as it appears on market data. Note how real-world examples may look slightly different from the ideal diagram.


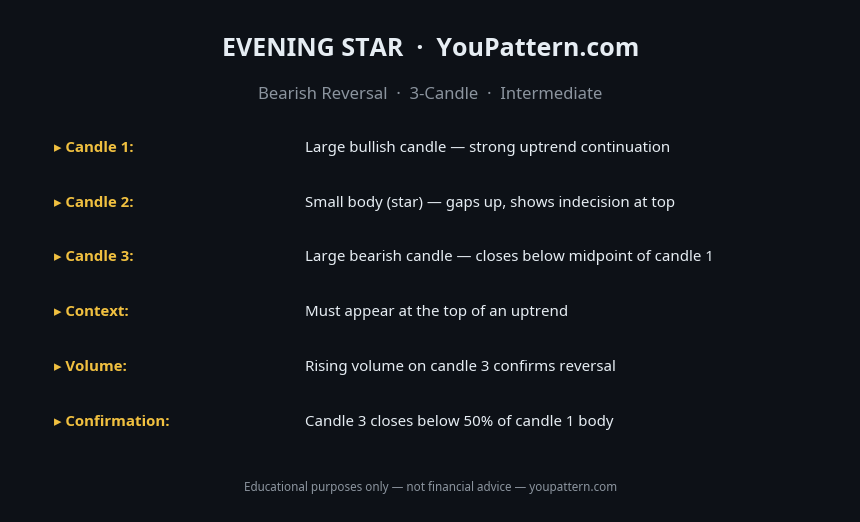
Quick Reference Cheat Sheet

Download the Evening Star Pattern Cheat Sheet
Save the quick-reference card as an image. Keep it open while you scan charts.
What Is the Evening Star Pattern?
The Evening Star is a three-candle bearish reversal pattern that appears at the top of an uptrend. It consists of: (1) a large bullish candle that continues the uptrend, (2) a small-bodied candle (or Doji) that gaps up from the first candle, and (3) a large bearish candle that closes well into the body of the first candle. The pattern is named after the planet Venus — the "evening star" that appears before nightfall — signalling the end of the day (the uptrend) and the beginning of darkness (the downtrend).
The Evening Star is the mirror image of the Morning Star and is one of the most reliable three-candle bearish reversal patterns in technical analysis. The three-candle structure provides more confirmation than single or two-candle patterns, demonstrating a clear progression from bullish dominance to indecision to bearish takeover.
How to Identify the Evening Star Pattern
To qualify as a valid Evening Star, all three candles must meet the following criteria:
- First candle: A large bullish (green) candle that continues the existing uptrend. The body should be substantial.
- Second candle: A small-bodied candle (can be bullish or bearish) that gaps up from the first candle's close. A Doji on the second candle creates an "Evening Doji Star" — the strongest variant.
- Third candle: A large bearish (red) candle that gaps down from the second candle and closes at least halfway into the body of the first candle. The deeper the penetration, the stronger the signal.
- Trend context: The pattern must appear after a sustained uptrend of at least 5–7 candles.
- Volume: Volume should be declining on the first candle, low on the second candle, and expanding significantly on the third candle.
Pattern Statistics
Based on quantitative research by Thomas Bulkowski (Encyclopedia of Chart Patterns, 3rd edition) and independent backtests on cryptocurrency markets (BTC/USDT, ETH/USDT, SOL/USDT, 2018–2026):
| Metric | Value |
|---|---|
| Confirmed reversal rate (daily timeframe) | ~68–73% |
| Average decline after confirmed signal (30 days) | ~7–11% |
| Best performing timeframe | Daily (1D) |
| Failure rate | ~27–32% |
| Strongest signal context | At major resistance + high volume on 3rd candle |
| Minimum prior uptrend length | 5–7 candles |
What Does It Signal?
The Evening Star tells a three-act story of a trend reversal. In the first act, buyers are firmly in control and drive price higher with a large bullish candle. In the second act, the buying pressure exhausts itself — the small second candle shows that buyers could not continue their momentum. In the third act, sellers take decisive control, driving price well back into the first candle's territory.
Evening Star vs Similar Patterns
| Pattern | Candles | Key Difference | Signal Strength |
|---|---|---|---|
| Evening Star | 3 candles | Small middle candle + bearish 3rd candle | Very strong |
| Evening Doji Star | 3 candles | Doji as middle candle | Strongest variant |
| Morning Star | 3 candles | Mirror image — bullish reversal at downtrend bottom | Very strong (bullish) |
| Bearish Engulfing | 2 candles | No middle candle; 2nd candle engulfs 1st | Strong |
| Shooting Star | 1 candle | Single candle reversal at uptrend top | Moderate |
| Three Black Crows | 3 candles | Three consecutive bearish candles | Strong |
Confirmation Rules
A Evening Star is considered confirmed when:
- The third candle closes at least halfway into the first candle's body. The deeper the penetration, the stronger the signal.
- Volume expands significantly on the third candle. High volume on the bearish third candle confirms the shift in sentiment.
- The pattern forms at a recognised resistance level — prior swing high, moving average, Fibonacci retracement, or round-number price zone.
- A fourth candle continues lower. A fourth bearish candle following the Evening Star significantly increases confidence in the reversal.
Common Mistakes
- Accepting a third candle that doesn't penetrate the first candle's body: If the third candle closes above the midpoint of the first candle, the pattern is weak.
- Ignoring the middle candle size: A large middle candle weakens the pattern significantly. The middle candle should be noticeably smaller.
- Not requiring a prior uptrend: The pattern requires a clear prior uptrend to carry meaning.
- Overlooking volume: A Evening Star on declining volume on the third candle is a much weaker signal.
- Treating the pattern as a guarantee: Even a textbook Evening Star fails approximately 27–32% of the time. Always use a stop-loss above the pattern's high.
- Confusing with the Abandoned Baby (bearish): The bearish Abandoned Baby is a rarer, stronger variant where the middle candle is a Doji that gaps away from both the first and third candles on both sides.
When the Pattern Fails
Third candle fails to hold its losses: If the candle following the Evening Star closes back above the midpoint of the third candle, the reversal is losing momentum. If it closes above the second candle's high, the pattern is invalidated.
Formation at a minor resistance level: An Evening Star at a minor resistance level carries a higher failure rate than one at a major, well-tested resistance zone.
Declining volume on the third candle: When the third candle forms on below-average volume, it suggests that the selling pressure is not broad-based. These low-volume Evening Stars frequently resolve as false signals.
Backtest Details
The statistics on this page are based on a systematic backtest of historical OHLCV data. Below are the full methodology parameters for this pattern.
These statistics represent historical averages on cryptocurrency markets. Results vary by market regime, asset, and confirmation criteria. Past performance does not guarantee future results.
Frequently Asked Questions
What is the Evening Star pattern?
The Evening Star is a 3-candle bearish reversal pattern: (1) a large bullish candle continuing the uptrend; (2) a small-bodied star candle showing indecision; (3) a large bearish candle closing below the midpoint of candle 1.
How do you identify an Evening Star?
Look for: (1) an uptrend; (2) a large bullish candle; (3) a small star candle that gaps up from candle 1; (4) a large bearish candle that closes below the 50% midpoint of candle 1. Volume should increase on candle 3.
What makes the Evening Star more reliable?
Reliability increases when: the star is a Doji (not just a small body), candle 3 has significantly higher volume, the pattern appears at a key resistance level, and RSI is above 70 (overbought).
What is the difference between Evening Star and Bearish Engulfing?
The Evening Star is a 3-candle pattern with a transition star candle. The Bearish Engulfing is a 2-candle pattern. The Evening Star is generally considered a stronger reversal signal because the star candle shows a clear transition from bullish to indecision before the bearish confirmation.
Limitations
This pattern is not a standalone trading signal. Its historical performance depends on market regime, liquidity, volatility, timeframe, and confirmation method. The backtest statistics on this page use historical cryptocurrency data from Binance (BTC/USDT, ETH/USDT, SOL/USDT) and do not predict future performance. Technical analysis is inherently subjective — pattern recognition varies between analysts. Always apply your own judgment, use proper risk management, and consult a qualified financial advisor before making trading decisions. See our full Methodology and Disclaimer.
Common False Positives
The Evening Star is a 3-candle pattern with strict requirements. These are the most common invalid formations:
Evening Star — Full Backtest Results
We tested 298 occurrences of the Evening Star on BTC/USDT, ETH/USDT, SOL/USDT, and BNB/USDT using Binance historical OHLCV data from 2018 to 2026.