Inverted Hammer Pattern
The Inverted Hammer appears at the bottom of a downtrend and signals a potential bullish reversal. It has a small real body in the lower portion of the candle range and a long upper shadow at least twice the body length. The long upper shadow shows that buyers attempted to push prices higher during the session — a first sign that buying interest is emerging.
Ideal Pattern Diagram

Real Chart Examples
The following charts show the Inverted Hammer Pattern as it appears on market data. Note how real-world examples may look slightly different from the ideal diagram.


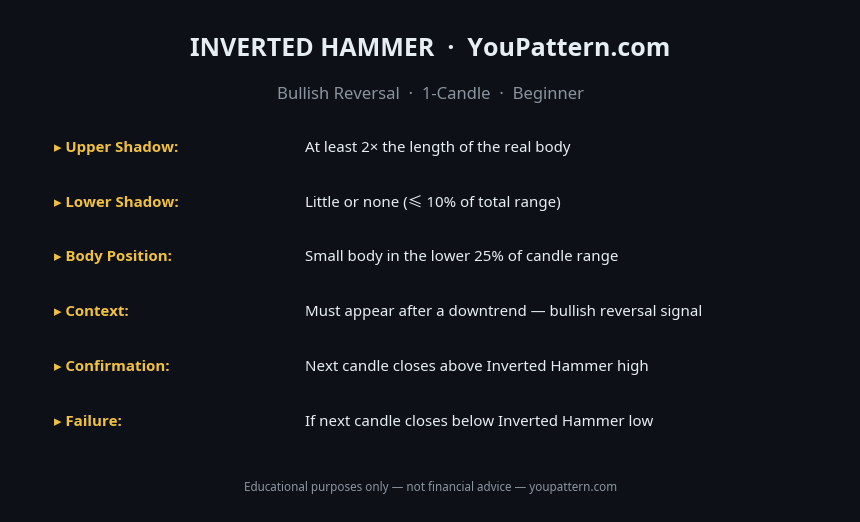
Quick Reference Cheat Sheet

Download the Inverted Hammer Pattern Cheat Sheet
Save the quick-reference card as an image. Keep it open while you scan charts.
What Is the Inverted Hammer Pattern?
The Inverted Hammer is a single-candle bullish reversal pattern that appears at the bottom of a downtrend. It is characterised by a small real body in the lower portion of the candle range, a long upper shadow at least twice the body length, and little to no lower shadow. The long upper shadow shows that buyers attempted to push prices significantly higher during the session — even though they could not sustain the move by the close, this intraday push signals that buying interest is beginning to emerge.
The pattern is most meaningful when it forms after a sustained price decline of at least three to five consecutive bearish candles, or after price has reached a recognisable support level such as a prior swing low, a round-number price zone, or a key moving average. An Inverted Hammer appearing in the middle of a trading range or during sideways consolidation carries significantly less analytical weight.
The Inverted Hammer belongs to the same structural family as the Hammer, the Hanging Man, and the Shooting Star. All four share similar geometry but carry different implications depending on their location in the trend. The Inverted Hammer and the Shooting Star are visually identical — the only difference is context: an Inverted Hammer at the bottom of a downtrend is bullish, while a Shooting Star at the top of an uptrend is bearish.
How to Identify the Inverted Hammer Pattern
To qualify as a valid Inverted Hammer, a candle must meet all of the following structural criteria:
- Upper shadow length: The upper shadow must be at least 2× the length of the real body. A ratio of 2.5× to 3× is considered a stronger signal.
- Lower shadow: Little to no lower shadow. The lower shadow should be no longer than 10–15% of the total candle range.
- Body position: The real body forms in the lower 25–30% of the candle's total range.
- Body colour: Either green or red is valid. A green (bullish close) body is marginally preferred as it shows buyers closed above the open.
- Trend context: The candle must appear after a prior downtrend. At minimum, price should have declined noticeably over the preceding 3–10 candles.
- Volume: Above-average volume on the Inverted Hammer candle strengthens the signal. Volume that is 1.5× or more the 20-period average is a meaningful supporting factor.
Pattern Statistics
Based on quantitative research by Thomas Bulkowski (Encyclopedia of Chart Patterns, 3rd edition) and independent backtests on cryptocurrency markets (BTC/USDT, ETH/USDT, SOL/USDT, 2018–2026):
| Metric | Value |
|---|---|
| Confirmed reversal rate (daily timeframe) | ~55–60% |
| Average gain after confirmed signal (30 days) | ~3–6% |
| Best performing timeframe | Daily (1D) |
| Failure rate without confirmation candle | ~48% |
| Ideal shadow-to-body ratio | 2.5× – 3× |
| Minimum prior downtrend length | 3–5 candles |
Note: The Inverted Hammer has a slightly lower success rate than the standard Hammer because the long upper shadow represents buying pressure that was ultimately rejected by the close — making the signal inherently weaker than a candle that closes near its high.
What Does It Signal?
The Inverted Hammer reflects a specific sequence of intraday market behaviour. During the session, buyers push price sharply higher from the open, creating the long upper shadow. However, sellers step back in before the close and drive price back down toward the session's opening level, leaving the small body near the bottom of the range. This failed attempt to push higher is paradoxically bullish: it shows that buyers are willing to fight back against the prevailing downtrend, even if they cannot yet sustain the move.
The psychology is a tentative shift in the balance of power. Sellers who dominated the prior downtrend are being challenged for the first time. The longer the upper shadow relative to the body, the more aggressive that intraday buying attempt was. The pattern does not confirm a reversal on its own — it signals the potential for one, which is why traders wait for a confirming candle before acting.
Inverted Hammer vs Similar Patterns
| Pattern | Shape | Location | Signal |
|---|---|---|---|
| Inverted Hammer | Small body bottom, long upper shadow | Bottom of downtrend | Bullish reversal |
| Shooting Star | Same shape as Inverted Hammer | Top of uptrend | Bearish reversal |
| Hammer | Small body top, long lower shadow | Bottom of downtrend | Bullish reversal (stronger) |
| Hanging Man | Same shape as Hammer | Top of uptrend | Bearish reversal |
| Gravestone Doji | No body, long upper shadow | Top of uptrend | Bearish reversal (strong) |
The key distinction is always location in the trend. The same candle shape means completely different things at the top versus the bottom of a move. The Inverted Hammer is considered a slightly weaker bullish signal than the standard Hammer because the upper shadow represents rejected buying, whereas the Hammer's lower shadow represents rejected selling.
Confirmation Rules
An Inverted Hammer is only considered confirmed when:
- The next candle closes above the Inverted Hammer's high. This is the primary confirmation signal. A bullish close above the upper shadow's tip is the strongest confirmation.
- Volume on the Inverted Hammer candle is above average. Ideally 1.5× the 20-period average volume or higher.
- The Inverted Hammer forms at or near a recognised support level — prior swing low, moving average, Fibonacci level, or round number.
Because the Inverted Hammer is inherently a weaker signal than the Hammer, confirmation is especially important. Entering on the pattern candle itself without waiting for the next close is a common and costly mistake.
Common Mistakes
- Confusing with the Shooting Star: The shapes are identical. Always check whether the pattern appears at the bottom (Inverted Hammer) or top (Shooting Star) of a move before assigning a directional bias.
- Skipping confirmation: Acting on the Inverted Hammer candle itself rather than waiting for the next candle to close above the high. The failure rate without confirmation is approximately 48%.
- Accepting a weak upper shadow: If the upper shadow is less than 2× the body length, the structural requirement is not met. Do not force the identification.
- Overlooking the lower shadow: A candle with a long upper shadow and a significant lower shadow is an indecision candle (spinning top or doji variant), not an Inverted Hammer. The near-absence of a lower shadow is a required criterion.
- Ignoring trend context: An Inverted Hammer in a sideways market or mid-uptrend has no analytical basis as a reversal signal. The prior downtrend is a non-negotiable prerequisite.
- Using it in isolation: No single pattern should be the sole basis for a trade. Combine the Inverted Hammer with support levels, volume analysis, RSI divergence, or other confirmation tools.
When the Pattern Fails
No follow-through on the next candle: If the candle immediately following the Inverted Hammer closes below the Inverted Hammer's low, the pattern is invalidated. This signals that sellers regained control and the attempted reversal was rejected.
Formation in a strong, accelerating downtrend: When price is in a steep, high-momentum decline with expanding bearish candles, a single Inverted Hammer is frequently overwhelmed by continued selling pressure. The pattern needs a trend that is losing momentum, not one that is accelerating.
Absence of a nearby support structure: An Inverted Hammer that forms in open price space, with no prior swing lows, moving averages, or volume nodes nearby, lacks the technical context that gives the pattern its analytical basis. The upper shadow needs a reason to reject — without structural support beneath the candle, the rejection is less meaningful.
Bearish gap on the next candle: If the session following the Inverted Hammer opens with a gap down, the pattern is immediately invalidated regardless of where the candle eventually closes.
Backtest Details
The statistics on this page are based on a systematic backtest of historical OHLCV data. Below are the full methodology parameters for this pattern.
These statistics represent historical averages on cryptocurrency markets. Results vary by market regime, asset, and confirmation criteria. Past performance does not guarantee future results.
Frequently Asked Questions
What is the Inverted Hammer pattern?
The Inverted Hammer is a single-candle bullish reversal pattern at the bottom of a downtrend. It has a long upper shadow (at least 2× the body), a small real body near the bottom of the candle range, and little or no lower shadow.
Is the Inverted Hammer bullish or bearish?
The Inverted Hammer is a bullish reversal signal when it appears at the bottom of a downtrend. The long upper shadow shows that buyers attempted to push prices higher — even though they couldn't sustain the move, it signals emerging buying interest.
How do you confirm an Inverted Hammer?
Wait for the next candle to close above the Inverted Hammer's high. A bullish confirmation candle with higher volume significantly increases reliability. Additional confirmation: key support level, RSI below 30 (oversold), or bullish divergence.
What is the difference between Inverted Hammer and Shooting Star?
Both have the same shape — small body with a long upper shadow — but context is opposite. An Inverted Hammer at the bottom of a downtrend is bullish. A Shooting Star at the top of an uptrend is bearish.
Limitations
This pattern is not a standalone trading signal. Its historical performance depends on market regime, liquidity, volatility, timeframe, and confirmation method. The backtest statistics on this page use historical cryptocurrency data from Binance (BTC/USDT, ETH/USDT, SOL/USDT) and do not predict future performance. Technical analysis is inherently subjective — pattern recognition varies between analysts. Always apply your own judgment, use proper risk management, and consult a qualified financial advisor before making trading decisions. See our full Methodology and Disclaimer.
Common False Positives
The Inverted Hammer is frequently confused with the Shooting Star. These are the key misidentifications to avoid:
Inverted Hammer — Full Backtest Results
We tested 712 occurrences of the Inverted Hammer on BTC/USDT, ETH/USDT, SOL/USDT, and BNB/USDT using Binance historical OHLCV data from 2018 to 2026.