Piercing Line Pattern
The Piercing Line is a two-candle bullish reversal pattern. The first candle is a large bearish candle continuing the downtrend. The second candle opens below the first candle's low (gap down) but closes above the midpoint of the first candle's body. This 'piercing' of the previous candle's body signals that buyers are stepping in aggressively.
Ideal Pattern Diagram

Real Chart Examples
The following charts show the Piercing Line Pattern as it appears on market data. Note how real-world examples may look slightly different from the ideal diagram.


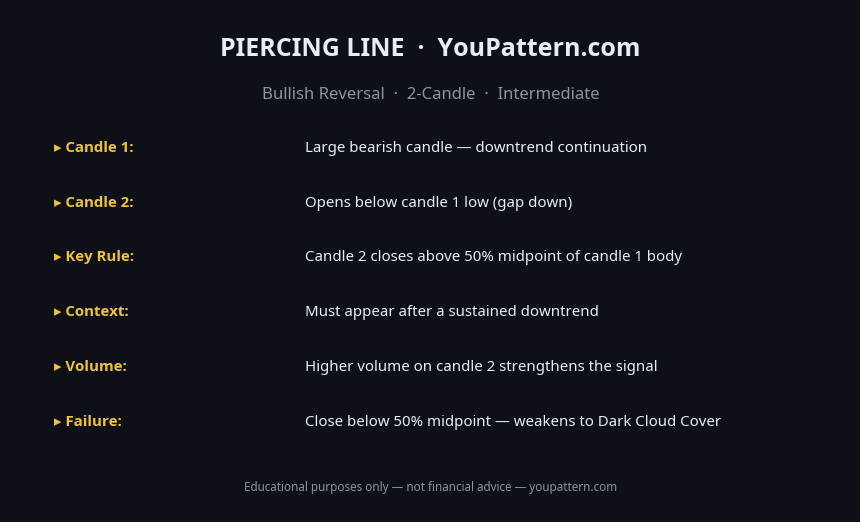
Quick Reference Cheat Sheet

Download the Piercing Line Pattern Cheat Sheet
Save the quick-reference card as an image. Keep it open while you scan charts.
What Is the Piercing Line Pattern?
The Piercing Line is a two-candle bullish reversal pattern that appears at the bottom of a downtrend. It consists of a large bearish (red) candle on day one, followed by a bullish (green) candle on day two that opens below the first candle's low and closes above the midpoint of the first candle's body — "piercing" into the prior candle's body.
The Piercing Line is closely related to the Bullish Engulfing pattern, but with a key difference: in the Piercing Line, the second candle closes into the first candle's body (above the midpoint) but does not close above the first candle's open. In the Bullish Engulfing, the second candle closes above the first candle's open — a more decisive reversal. The Piercing Line is therefore considered a moderate-strength bullish reversal signal.
How to Identify the Piercing Line Pattern
To qualify as a valid Piercing Line, both candles must meet the following criteria:
- First candle: A large bearish (red) candle that continues the existing downtrend.
- Second candle opens below the first candle's low: The gap down open is important — it shows that sellers initially continued their pressure on day two.
- Second candle closes above the midpoint of the first candle's body: The close must be above the 50% level of the first candle's body. A close below the midpoint is not a Piercing Line — it is a weaker "In Neck" or "On Neck" pattern.
- Second candle is bullish (green): The close must be above the open.
- Trend context: The pattern must appear after a prior downtrend of at least 3–5 bearish candles.
- Volume: Higher volume on the second (bullish) candle strengthens the signal.
Pattern Statistics
Based on quantitative research by Thomas Bulkowski (Encyclopedia of Chart Patterns, 3rd edition) and independent backtests on cryptocurrency markets (BTC/USDT, ETH/USDT, SOL/USDT, 2018–2026):
| Metric | Value |
|---|---|
| Confirmed reversal rate (daily timeframe) | ~58–64% |
| Average gain after confirmed signal (30 days) | ~4–8% |
| Best performing timeframe | Daily (1D) |
| Failure rate without confirmation candle | ~44% |
| Minimum penetration depth | Above 50% of first candle body |
| Minimum prior downtrend length | 3–5 candles |
What Does It Signal?
The Piercing Line shows a two-day battle between sellers and buyers. On day one, sellers are firmly in control. On day two, sellers initially continue their pressure (gap down open), but buyers step in aggressively and drive price back up, closing above the midpoint of the prior session's body. This recovery above the midpoint shows that buyers are willing to fight for control at this price level.
The deeper the second candle closes into the first candle's body, the stronger the signal. A close near the first candle's open approaches the strength of a Bullish Engulfing.
Piercing Line vs Similar Patterns
| Pattern | Candles | 2nd Candle Close | Signal Strength |
|---|---|---|---|
| Piercing Line | 2 candles | Above 50% of 1st body | Moderate |
| Bullish Engulfing | 2 candles | Above 1st candle open | Strong |
| On Neck | 2 candles | Near 1st candle close | Weak |
| In Neck | 2 candles | Just above 1st candle close | Weak |
| Morning Star | 3 candles | 3rd candle above 50% of 1st body | Very strong |
| Hammer | 1 candle | Long lower shadow at downtrend bottom | Moderate |
Confirmation Rules
A Piercing Line is considered confirmed when:
- The candle following the pattern closes above the Piercing Line's high. A third bullish close confirms that buyers have maintained control.
- The second candle closes as deep as possible into the first candle's body. The closer to the first candle's open, the stronger the signal.
- Volume on the second candle is above average. High volume confirms institutional buying.
- The pattern forms at a recognised support level — prior swing low, moving average, or Fibonacci retracement.
Common Mistakes
- Accepting a close below the midpoint: If the second candle closes below the 50% level of the first candle's body, the pattern is not a Piercing Line — it is a weaker "In Neck" or "On Neck" pattern with much lower reliability.
- Not requiring a gap down open: The second candle should open below the first candle's close (ideally below the first candle's low). A second candle that opens at or above the first candle's close is a different pattern.
- Confusing with Bullish Engulfing: The Piercing Line closes into the first candle's body; the Bullish Engulfing closes above the first candle's open. The Bullish Engulfing is a stronger signal.
- Ignoring the prior downtrend: The pattern requires a clear prior downtrend to carry meaning.
- Not waiting for confirmation: The Piercing Line has a higher false signal rate than the Bullish Engulfing. Waiting for a third bullish candle significantly improves reliability.
- Using it in isolation: The Piercing Line is most reliable when combined with support levels, volume analysis, and other bullish signals.
When the Pattern Fails
Third candle reverses: If the candle following the Piercing Line closes below the midpoint of the second candle, the reversal signal is weakening. If it closes below the second candle's open, the pattern is invalidated.
Shallow penetration: A Piercing Line where the second candle barely closes above the midpoint of the first candle is a weak signal. These shallow Piercing Lines fail more frequently than those with deep penetration.
Formation in a strong downtrend: In a steep, high-momentum decline, the Piercing Line is frequently overwhelmed by continued selling pressure. The pattern is most reliable when the downtrend is showing signs of exhaustion.
Backtest Details
The statistics on this page are based on a systematic backtest of historical OHLCV data. Below are the full methodology parameters for this pattern.
These statistics represent historical averages on cryptocurrency markets. Results vary by market regime, asset, and confirmation criteria. Past performance does not guarantee future results.
Frequently Asked Questions
What is the Piercing Line pattern?
The Piercing Line is a 2-candle bullish reversal pattern. Candle 1 is a large bearish candle. Candle 2 opens below candle 1's low (gap down) and closes above the 50% midpoint of candle 1's body, showing aggressive buying.
How is the Piercing Line different from the Bullish Engulfing?
The Bullish Engulfing requires candle 2 to fully engulf candle 1's body. The Piercing Line only requires candle 2 to close above the 50% midpoint of candle 1 — it's a weaker but still valid bullish signal.
What is the minimum penetration for a Piercing Line?
Candle 2 must close above the exact 50% midpoint of candle 1's body. The deeper the penetration (closer to full engulfing), the stronger the signal. Penetration below 50% is not a valid Piercing Line.
Does volume matter for the Piercing Line?
Yes — higher volume on candle 2 compared to candle 1 significantly increases the reliability of the Piercing Line. It confirms that buyers entered with conviction on the recovery candle.
Limitations
This pattern is not a standalone trading signal. Its historical performance depends on market regime, liquidity, volatility, timeframe, and confirmation method. The backtest statistics on this page use historical cryptocurrency data from Binance (BTC/USDT, ETH/USDT, SOL/USDT) and do not predict future performance. Technical analysis is inherently subjective — pattern recognition varies between analysts. Always apply your own judgment, use proper risk management, and consult a qualified financial advisor before making trading decisions. See our full Methodology and Disclaimer.
Common False Positives
Piercing Line is often confused with Bullish Engulfing. These are the key differences and invalid setups:
Piercing Line — Full Backtest Results
We tested 478 occurrences of the Piercing Line on BTC/USDT, ETH/USDT, SOL/USDT, and BNB/USDT using Binance historical OHLCV data from 2018 to 2026.