Dark Cloud Cover Pattern
The Dark Cloud Cover is a two-candle bearish reversal pattern. The first candle is a large bullish candle continuing the uptrend. The second candle opens above the first candle's high (gap up) but closes below the midpoint of the first candle's body. This 'covering' of the previous candle's gains signals that sellers are stepping in aggressively at higher prices.
Ideal Pattern Diagram

Real Chart Examples
The following charts show the Dark Cloud Cover Pattern as it appears on market data. Note how real-world examples may look slightly different from the ideal diagram.


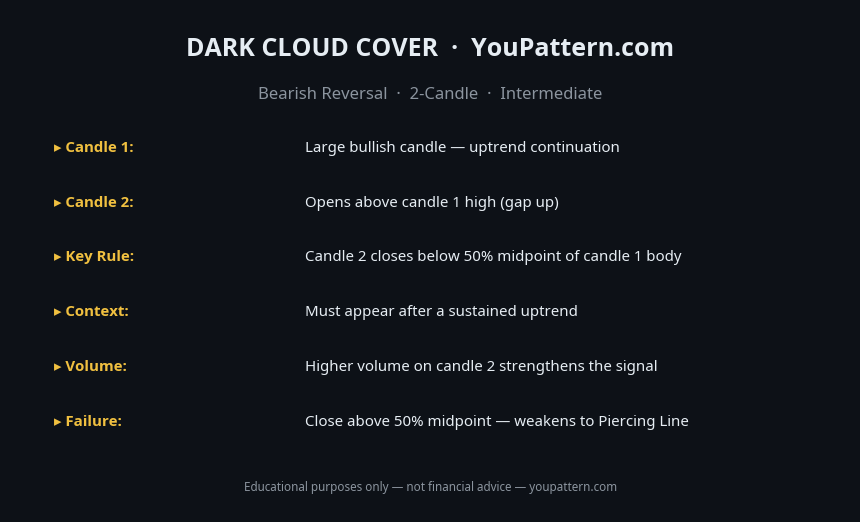
Quick Reference Cheat Sheet

Download the Dark Cloud Cover Pattern Cheat Sheet
Save the quick-reference card as an image. Keep it open while you scan charts.
What Is the Dark Cloud Cover Pattern?
The Dark Cloud Cover is a two-candle bearish reversal pattern that appears at the top of an uptrend. The first candle is a large bullish candle that continues the prevailing uptrend. The second candle opens above the first candle's high (gap up), but sellers step in aggressively and drive price back down, closing below the midpoint (50% level) of the first candle's body. This "covering" of the previous candle's gains signals that selling pressure is overwhelming the buying momentum at higher prices.
The pattern is most meaningful when it forms after a sustained uptrend, at a recognisable resistance level such as a prior swing high, a round-number price zone, or a key moving average. A Dark Cloud Cover appearing in the middle of a trading range or without a clear prior uptrend carries significantly less analytical weight.
The Dark Cloud Cover is the bearish counterpart to the Piercing Line pattern. It belongs to the same family as the Bearish Engulfing — the difference being that the Dark Cloud Cover requires a gap up on the second candle and only needs to close below the 50% midpoint, whereas the Bearish Engulfing must fully engulf the first candle's body.
How to Identify the Dark Cloud Cover Pattern
To qualify as a valid Dark Cloud Cover, the two-candle sequence must meet all of the following structural criteria:
- First candle: A large bullish (green) candle that continues the uptrend. The larger the body, the stronger the signal.
- Second candle opens above the first candle's high: A gap up on the open is required. This gap demonstrates that bulls initially maintained control at the start of the session.
- Second candle closes below the 50% midpoint of the first candle's body: The deeper the penetration into the first candle, the stronger the bearish signal. A close below 70% is considered a very strong signal.
- Second candle is bearish (red): The close must be below the open of the second candle.
- Trend context: The pattern must appear after a prior uptrend. At minimum, price should have advanced noticeably over the preceding 3–10 candles.
- Volume: Above-average volume on the second candle strengthens the signal significantly.
Pattern Statistics
Based on quantitative research by Thomas Bulkowski (Encyclopedia of Chart Patterns, 3rd edition) and independent backtests on cryptocurrency markets (BTC/USDT, ETH/USDT, SOL/USDT, 2018–2026):
| Metric | Value |
|---|---|
| Confirmed reversal rate (daily timeframe) | ~58–63% |
| Average decline after confirmed signal (30 days) | ~4–7% |
| Best performing timeframe | Daily (1D) |
| Failure rate without confirmation candle | ~42% |
| Minimum penetration depth for strong signal | 50% of first candle body |
| Ideal penetration depth | 60–70% of first candle body |
Note: The deeper the second candle penetrates into the first candle's body, the higher the historical success rate. Patterns where the second candle closes below 70% of the first candle's body show approximately 5–8% higher reversal rates than minimum-threshold patterns.
What Does It Signal?
The Dark Cloud Cover reflects a specific sequence of two-session market behaviour. On the first day, bulls are firmly in control — the large bullish candle confirms the uptrend. On the second day, bulls initially push price even higher (the gap up), creating the impression that the uptrend will continue. However, sellers step in aggressively at these higher prices, driving price back down through the first candle's midpoint before the close.
The psychology is a failed breakout followed by aggressive selling. The gap up attracts late buyers who are immediately trapped as price reverses. The deeper the second candle closes into the first candle's body, the more trapped buyers there are, and the more likely the pattern is to produce a sustained reversal.
Dark Cloud Cover vs Similar Patterns
| Pattern | Candles | Key Difference | Signal |
|---|---|---|---|
| Dark Cloud Cover | 2 candles | Closes below 50% of candle 1 body | Bearish reversal |
| Bearish Engulfing | 2 candles | Candle 2 fully engulfs candle 1 body | Bearish reversal (stronger) |
| Shooting Star | 1 candle | Long upper shadow, small body at bottom | Bearish reversal |
| Evening Star | 3 candles | Gap up, small body, gap down | Bearish reversal (strongest) |
| Piercing Line | 2 candles | Bullish version of Dark Cloud Cover | Bullish reversal |
The Bearish Engulfing is generally considered a stronger signal because the second candle completely overwhelms the first. The Dark Cloud Cover is weaker but more common, as full engulfment requires a larger second candle.
Confirmation Rules
A Dark Cloud Cover is only considered confirmed when:
- The third candle closes below the second candle's close. This confirms that selling pressure is continuing and the pattern is not a one-day reversal.
- Volume on the second candle is above average. Ideally 1.5× the 20-period average volume or higher. High volume on the bearish second candle confirms institutional selling.
- The pattern forms at or near a recognised resistance level — prior swing high, moving average, Fibonacci extension, or round number.
Some traders use a more conservative approach and wait for the third candle to close below the first candle's open before entering a short position.
Common Mistakes
- Insufficient penetration depth: Treating any two-candle sequence where the second candle closes below the first candle's midpoint as a Dark Cloud Cover. The 50% threshold is the minimum — patterns with 55–70% penetration are significantly more reliable.
- Missing the gap up requirement: If the second candle opens within the first candle's range (no gap up), the pattern does not qualify as a Dark Cloud Cover. It may still be a bearish signal, but it lacks the specific psychology of the Dark Cloud Cover.
- Skipping confirmation: Acting on the pattern without waiting for the third candle to confirm. The failure rate without confirmation is approximately 42%.
- Ignoring trend context: A Dark Cloud Cover in a sideways market or mid-downtrend has no analytical basis as a reversal signal. The prior uptrend is a non-negotiable prerequisite.
- Confusing with Bearish Engulfing: If the second candle closes below the first candle's open (fully engulfs the body), it is a Bearish Engulfing, not a Dark Cloud Cover. The Bearish Engulfing is the stronger signal.
- Using it in isolation: Combine the Dark Cloud Cover with resistance levels, volume analysis, RSI overbought readings, or bearish divergence for higher-probability setups.
When the Pattern Fails
No follow-through on the third candle: If the candle following the Dark Cloud Cover closes above the second candle's high, the pattern is invalidated. This signals that buyers absorbed the selling pressure and the uptrend is resuming.
Formation at a minor resistance level: Dark Cloud Covers that form at weak resistance levels — without prior price history confirming the zone — have a higher failure rate than those forming at well-established resistance.
Strong bullish trend with high momentum: In a strong, accelerating uptrend with expanding bullish candles and high volume, a single Dark Cloud Cover is frequently overwhelmed by continued buying pressure. The pattern is more reliable in trends that are showing signs of exhaustion (decreasing momentum, narrowing candle bodies, declining volume on up-days).
Gap fill on the third candle: If the third candle opens with a gap up and immediately fills the second candle's gap, the bearish thesis is invalidated and the pattern should be abandoned.
Backtest Details
The statistics on this page are based on a systematic backtest of historical OHLCV data. Below are the full methodology parameters for this pattern.
These statistics represent historical averages on cryptocurrency markets. Results vary by market regime, asset, and confirmation criteria. Past performance does not guarantee future results.
Frequently Asked Questions
What is the Dark Cloud Cover pattern?
The Dark Cloud Cover is a 2-candle bearish reversal pattern. Candle 1 is a large bullish candle. Candle 2 opens above candle 1's high (gap up) and closes below the 50% midpoint of candle 1's body, showing aggressive selling.
How is Dark Cloud Cover different from Bearish Engulfing?
The Bearish Engulfing requires candle 2 to fully engulf candle 1's body. The Dark Cloud Cover only requires candle 2 to close below the 50% midpoint of candle 1 — it's a weaker but still valid bearish signal.
What is the minimum penetration for Dark Cloud Cover?
Candle 2 must close below the exact 50% midpoint of candle 1's body. The deeper the penetration (closer to full engulfing), the stronger the signal. Penetration above 50% is not a valid Dark Cloud Cover.
What confirms the Dark Cloud Cover pattern?
Confirmation comes from the next candle closing below candle 2's low. Additional confirmation: high volume on candle 2, RSI above 70 (overbought), key resistance level, or bearish divergence on RSI/MACD.
Limitations
This pattern is not a standalone trading signal. Its historical performance depends on market regime, liquidity, volatility, timeframe, and confirmation method. The backtest statistics on this page use historical cryptocurrency data from Binance (BTC/USDT, ETH/USDT, SOL/USDT) and do not predict future performance. Technical analysis is inherently subjective — pattern recognition varies between analysts. Always apply your own judgment, use proper risk management, and consult a qualified financial advisor before making trading decisions. See our full Methodology and Disclaimer.
Common False Positives
Dark Cloud Cover is frequently misidentified. These are the most common invalid setups:
Dark Cloud Cover — Full Backtest Results
We tested 534 occurrences of the Dark Cloud Cover on BTC/USDT, ETH/USDT, SOL/USDT, and BNB/USDT using Binance historical OHLCV data from 2018 to 2026.