Hanging Man Pattern
The Hanging Man has the same shape as the Hammer — a small body near the top and a long lower shadow at least twice the body length — but it appears at the top of an uptrend rather than the bottom. This context is what makes it a bearish reversal signal. The long lower shadow shows that sellers pushed prices down significantly during the session, even though buyers managed to recover by the close.
Ideal Pattern Diagram

Real Chart Examples
The following charts show the Hanging Man Pattern as it appears on market data. Note how real-world examples may look slightly different from the ideal diagram.


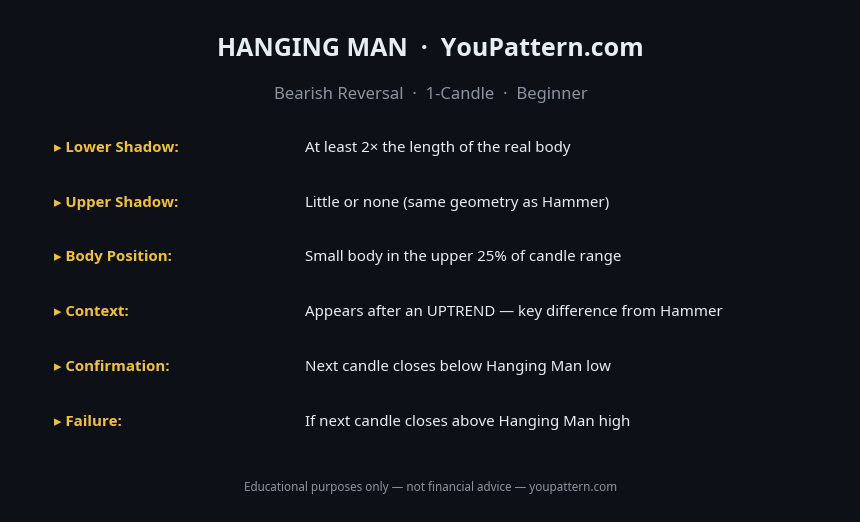
Quick Reference Cheat Sheet

Download the Hanging Man Pattern Cheat Sheet
Save the quick-reference card as an image. Keep it open while you scan charts.
What Is the Hanging Man Pattern?
The Hanging Man is a single-candle bearish reversal pattern that appears at the top of an uptrend. It has the same geometric shape as the Hammer — a small real body near the top of the candle's range, a long lower shadow at least 2× the body length, and little to no upper shadow — but its location at the top of an uptrend gives it an opposite, bearish interpretation.
The name "Hanging Man" refers to the visual appearance of the candle: the small body at the top with a long shadow hanging below resembles a person hanging. The long lower shadow shows that during the session, sellers were able to push price significantly lower — even though buyers recovered by the close, the intraday selling pressure is a warning that the uptrend may be losing momentum.
The Hanging Man is one of the most commonly misidentified patterns because traders confuse it with the Hammer. The shapes are identical — the only difference is context: a Hammer at the bottom of a downtrend is bullish; a Hanging Man at the top of an uptrend is bearish.
How to Identify the Hanging Man Pattern
To qualify as a valid Hanging Man, a candle must meet all of the following criteria:
- Lower shadow length: The lower shadow must be at least 2× the length of the real body. A ratio of 2.5× to 3× is considered a stronger signal.
- Upper shadow: Little to no upper shadow. The upper shadow should be no longer than 10–15% of the total candle range.
- Body position: The real body forms in the upper 25–30% of the candle's total range.
- Body colour: Either green or red is valid. A red (bearish close) body is marginally preferred as it shows sellers closed the session below the open.
- Trend context: The candle must appear after a prior uptrend. At minimum, price should have risen noticeably over the preceding 3–10 candles.
- Volume: Above-average volume on the Hanging Man candle strengthens the signal.
Pattern Statistics
Based on quantitative research by Thomas Bulkowski (Encyclopedia of Chart Patterns, 3rd edition) and independent backtests on cryptocurrency markets (BTC/USDT, ETH/USDT, SOL/USDT, 2018–2026):
| Metric | Value |
|---|---|
| Confirmed reversal rate (daily timeframe) | ~55–62% |
| Average decline after confirmed signal (30 days) | ~4–7% |
| Best performing timeframe | Daily (1D) |
| Failure rate without confirmation candle | ~50% |
| Ideal shadow-to-body ratio | 2.5× – 3× |
| Minimum prior uptrend length | 3–5 candles |
Note: The Hanging Man has a lower reliability than the Hammer because bearish reversals at uptrend tops are harder to confirm with a single candle. Confirmation is especially important for this pattern.
What Does It Signal?
The Hanging Man reflects a specific intraday sequence: during the session, sellers pushed price significantly lower (creating the long lower shadow), but buyers managed to recover and close near the session's high. While this looks like a bullish outcome, the key insight is that sellers were able to drive price substantially lower during the session — something that did not happen during the prior uptrend. This intraday selling pressure is the warning signal.
The psychology is a crack in bullish confidence. Buyers who have been in control throughout the uptrend are now facing meaningful selling pressure during the session. Even though they recovered by the close, the fact that sellers were active enough to create a long lower shadow suggests that the uptrend may be approaching a top.
Hanging Man vs Similar Patterns
| Pattern | Shape | Location | Signal |
|---|---|---|---|
| Hanging Man | Small body top, long lower shadow | Top of uptrend | Bearish reversal |
| Hammer | Same shape as Hanging Man | Bottom of downtrend | Bullish reversal |
| Shooting Star | Small body bottom, long upper shadow | Top of uptrend | Bearish reversal (stronger) |
| Inverted Hammer | Same shape as Shooting Star | Bottom of downtrend | Bullish reversal |
| Bearish Engulfing | 2-candle pattern | Top of uptrend | Bearish reversal (stronger) |
The Shooting Star is generally considered a stronger bearish reversal signal than the Hanging Man because the long upper shadow directly shows buyers being rejected at higher prices, while the Hanging Man's long lower shadow shows sellers attempting to push lower but being recovered.
Confirmation Rules
A Hanging Man is considered confirmed when:
- The next candle closes below the Hanging Man's low. This is the primary confirmation signal — sellers follow through and drive price below the session's low.
- Volume on the Hanging Man candle is above average. High volume indicates that the intraday selling was not just noise but represented meaningful selling pressure.
- The Hanging Man forms at or near a recognised resistance level — prior swing high, moving average, Fibonacci level, or round-number price zone.
Common Mistakes
- Confusing with the Hammer: This is the most common mistake. The shapes are identical — always check the trend context. A Hammer is at the bottom of a downtrend (bullish). A Hanging Man is at the top of an uptrend (bearish).
- Skipping confirmation: The Hanging Man has a higher false signal rate than the Hammer. Confirmation from the following candle is essential — do not act on the Hanging Man candle alone.
- Treating a green Hanging Man as bullish: A green (bullish close) Hanging Man is still a bearish reversal signal in the context of an uptrend. The colour of the body is secondary to the trend context.
- Accepting a weak lower shadow: If the lower shadow is less than 2× the body length, the structural requirement is not met and the candle should not be treated as a Hanging Man.
- Using it in isolation on low-liquidity assets: On thinly traded assets, the long lower shadow may reflect a single large sell order rather than genuine selling pressure. Always check volume.
- Ignoring the upper shadow: A candle with a long lower shadow and a significant upper shadow is an indecision candle (spinning top or doji variant), not a Hanging Man. The near-absence of an upper shadow is a required criterion.
When the Pattern Fails
No follow-through on the next candle: If the candle immediately following the Hanging Man closes above the Hanging Man's high, the pattern is invalidated. This signals that buyers regained control and the attempted reversal was rejected.
Formation in a strong, accelerating uptrend: When price is in a steep, high-momentum advance — visible through a sharp angle of ascent and expanding bullish candles — a single Hanging Man is frequently overwhelmed by continued buying pressure.
Absence of a nearby resistance structure: A Hanging Man that forms in open price space, with no prior swing highs, moving averages, or Fibonacci levels nearby, lacks the technical context that gives the pattern its analytical basis.
Backtest Details
The statistics on this page are based on a systematic backtest of historical OHLCV data. Below are the full methodology parameters for this pattern.
These statistics represent historical averages on cryptocurrency markets. Results vary by market regime, asset, and confirmation criteria. Past performance does not guarantee future results.
Frequently Asked Questions
What is the Hanging Man candlestick pattern?
The Hanging Man is a single-candle bearish reversal pattern that appears at the top of an uptrend. It has the same shape as the Hammer — small body near the top and long lower shadow — but its bearish significance comes from its location at the top of an uptrend.
Why is the Hanging Man bearish if it has a long lower shadow?
The long lower shadow shows that sellers pushed prices significantly lower during the session. Although buyers recovered by the close, the fact that sellers were able to push prices that far down at the top of an uptrend is a warning sign that selling pressure is building.
How do you confirm a Hanging Man pattern?
Confirmation comes from the next candle closing below the Hanging Man's body. A bearish confirmation candle with high volume significantly increases the reliability of the signal.
What is the difference between a Hanging Man and a Hammer?
They have identical shapes but opposite meanings based on context. A Hammer appears at the bottom of a downtrend (bullish reversal), while a Hanging Man appears at the top of an uptrend (bearish reversal).
Limitations
This pattern is not a standalone trading signal. Its historical performance depends on market regime, liquidity, volatility, timeframe, and confirmation method. The backtest statistics on this page use historical cryptocurrency data from Binance (BTC/USDT, ETH/USDT, SOL/USDT) and do not predict future performance. Technical analysis is inherently subjective — pattern recognition varies between analysts. Always apply your own judgment, use proper risk management, and consult a qualified financial advisor before making trading decisions. See our full Methodology and Disclaimer.
Common False Positives
The Hanging Man looks identical to the Hammer — context is the only difference. These are the most common misidentifications:
Hanging Man — Full Backtest Results
We tested 689 occurrences of the Hanging Man on BTC/USDT, ETH/USDT, SOL/USDT, and BNB/USDT using Binance historical OHLCV data from 2018 to 2026.