Inverse Head and Shoulders Pattern
The Inverse Head and Shoulders (also called Head and Shoulders Bottom) is the bullish mirror of the classic Head and Shoulders pattern. It consists of three troughs: a left shoulder, a deeper head, and a right shoulder that is higher than the head. A neckline connects the peaks between the troughs. The pattern is confirmed when price breaks above the neckline.
Ideal Pattern Diagram

Real Chart Examples
The following charts show the Inverse Head and Shoulders Pattern as it appears on market data. Note how real-world examples may look slightly different from the ideal diagram.


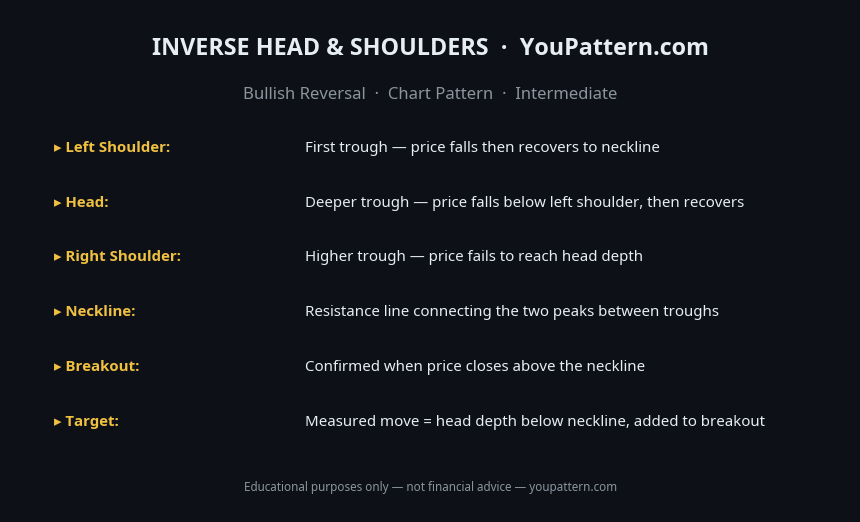
Quick Reference Cheat Sheet

Download the Inverse Head and Shoulders Pattern Cheat Sheet
Save the quick-reference card as an image. Keep it open while you scan charts.
What Is the Inverse Head and Shoulders Pattern?
The Inverse Head and Shoulders (also called Head and Shoulders Bottom) is a bullish reversal chart pattern that forms at the bottom of a downtrend. It consists of three troughs: a left shoulder, a deeper central trough (the head), and a right shoulder at approximately the same depth as the left shoulder. A neckline connects the peaks between the shoulders and the head. The pattern signals that the downtrend is losing momentum and a reversal to an uptrend is likely.
The Inverse Head and Shoulders is the mirror image of the Head and Shoulders pattern and is equally reliable. It is confirmed when price breaks above the neckline with increased volume, signalling that buyers have taken decisive control.
How to Identify the Inverse Head and Shoulders Pattern
To qualify as a valid Inverse Head and Shoulders, the pattern must meet the following criteria:
- Prior downtrend: The pattern must form after a clear, sustained downtrend.
- Left shoulder: A trough followed by a recovery to the neckline.
- Head: A deeper trough (below the left shoulder) followed by a recovery back to the neckline. The head is the lowest point of the pattern.
- Right shoulder: A trough at approximately the same depth as the left shoulder (within 5–10%), followed by a recovery toward the neckline.
- Neckline: A line connecting the two peaks between the shoulders and the head.
- Neckline breakout: The pattern is confirmed when price breaks above the neckline with increased volume.
- Volume: Volume should be highest on the left shoulder, lower on the head, and lowest on the right shoulder — then expand significantly on the neckline breakout.
Pattern Statistics
Based on quantitative research by Thomas Bulkowski (Encyclopedia of Chart Patterns, 3rd edition) and independent backtests on cryptocurrency markets (BTC/USDT, ETH/USDT, SOL/USDT, 2018–2026):
| Metric | Value |
|---|---|
| Confirmed breakout success rate | ~74–81% |
| Average gain after confirmed breakout (measured move) | ~38–52% of pattern height |
| Best performing timeframe | Daily (1D) and Weekly (1W) |
| Failure rate after neckline breakout | ~19–26% |
| Right shoulder depth vs left shoulder | Within 5–10% for strongest signals |
| Neckline retest rate | ~45–55% of confirmed patterns |
What Does It Signal?
The Inverse Head and Shoulders tells a story of a downtrend that has run out of momentum. The left shoulder forms as sellers push price to a new low, but buyers push back. Sellers attempt again and push to an even lower low (the head), but buyers push back again. On the third attempt (the right shoulder), sellers can only reach the level of the left shoulder — they can no longer reach the head's low. This failure to make a new low signals that selling momentum is exhausted.
When price breaks above the neckline, it confirms that buyers have taken control. The neckline was the last resistance level — once broken, the prior downtrend is officially reversed.
Inverse H&S vs Similar Patterns
| Pattern | Shape | Signal | Reliability |
|---|---|---|---|
| Inverse Head and Shoulders | Three troughs, middle deepest | Bullish reversal | Very high |
| Head and Shoulders | Three peaks, middle highest | Bearish reversal | Very high |
| Double Bottom | Two troughs at same level | Bullish reversal | High |
| Triple Bottom | Three troughs at same level | Bullish reversal | High |
| Cup and Handle | U-shape + small pullback | Bullish continuation | High |
Confirmation Rules
A Inverse Head and Shoulders is considered confirmed when:
- Price breaks above the neckline with increased volume. This is the primary confirmation signal.
- The right shoulder does not break below the head's low. If the right shoulder makes a new low below the head, the pattern is invalidated.
- Volume declines from left shoulder to right shoulder, then expands on breakout. This volume profile confirms weakening selling pressure followed by a surge of buying.
- A neckline retest after the breakout (price returns to the neckline from above) provides a second entry opportunity at a better risk/reward ratio.
Common Mistakes
- Entering before the neckline breakout: The pattern is only confirmed on the neckline breakout. Entering long at the right shoulder trough is a premature entry.
- Accepting an asymmetric pattern: A right shoulder that is significantly deeper than the left shoulder weakens the pattern.
- Ignoring volume on the breakout: A neckline breakout on low volume is a warning sign of a false breakout.
- Placing stop-losses too tight: A stop-loss just below the neckline is too tight. A stop below the right shoulder trough is more appropriate.
- Setting targets too aggressively: The measured move target is a guide, not a guarantee. Many patterns reach 60–80% of the measured move.
- Confusing with a triple bottom: In a triple bottom, all three troughs are at approximately the same level. In the Inverse Head and Shoulders, the middle trough (head) is deeper than the two shoulders.
When the Pattern Fails
Right shoulder breaks below the head: If price declines below the head's low during the right shoulder formation, the pattern is invalidated. This signals that sellers are still in control.
False neckline breakout: Price breaks above the neckline but quickly reverses back below it. This typically occurs on low volume.
Sloping neckline complications: When the neckline has a significant downward slope, the breakout point is lower than expected, and the measured move target is reduced.
Backtest Details
The statistics on this page are based on a systematic backtest of historical OHLCV data. Below are the full methodology parameters for this pattern.
These statistics represent historical averages on cryptocurrency markets. Results vary by market regime, asset, and confirmation criteria. Past performance does not guarantee future results.
Frequently Asked Questions
What is the Inverse Head and Shoulders pattern?
The Inverse Head and Shoulders is a bullish reversal chart pattern with three troughs: a left shoulder, a deeper head, and a right shoulder at approximately the same depth as the left shoulder. A neckline connects the two peaks between the troughs. A breakout above the neckline confirms the pattern.
How do you trade the Inverse Head and Shoulders?
Enter long when price breaks and closes above the neckline with increased volume. Place stop-loss below the right shoulder. The measured move target equals the distance from the head to the neckline, added to the breakout point.
What confirms the Inverse Head and Shoulders pattern?
Key confirmation signals: (1) price closes above the neckline; (2) volume increases significantly on the breakout candle; (3) price retests the neckline as support and holds; (4) RSI moves above 50 on the breakout.
How is Inverse Head and Shoulders different from Double Bottom?
The Inverse Head and Shoulders has three troughs with the middle (head) deeper. The Double Bottom has two equal troughs. Both are bullish reversals, but Inverse Head and Shoulders is generally considered more reliable due to its more complex structure.
Limitations
This pattern is not a standalone trading signal. Its historical performance depends on market regime, liquidity, volatility, timeframe, and confirmation method. The backtest statistics on this page use historical cryptocurrency data from Binance (BTC/USDT, ETH/USDT, SOL/USDT) and do not predict future performance. Technical analysis is inherently subjective — pattern recognition varies between analysts. Always apply your own judgment, use proper risk management, and consult a qualified financial advisor before making trading decisions. See our full Methodology and Disclaimer.
Common False Positives
Inverse Head and Shoulders is a bullish reversal pattern with several common failure modes:
Inverse Head and Shoulders — Full Backtest Results
We tested 194 occurrences of the Inverse Head and Shoulders on BTC/USDT, ETH/USDT, SOL/USDT, and BNB/USDT using Binance historical OHLCV data from 2018 to 2026.